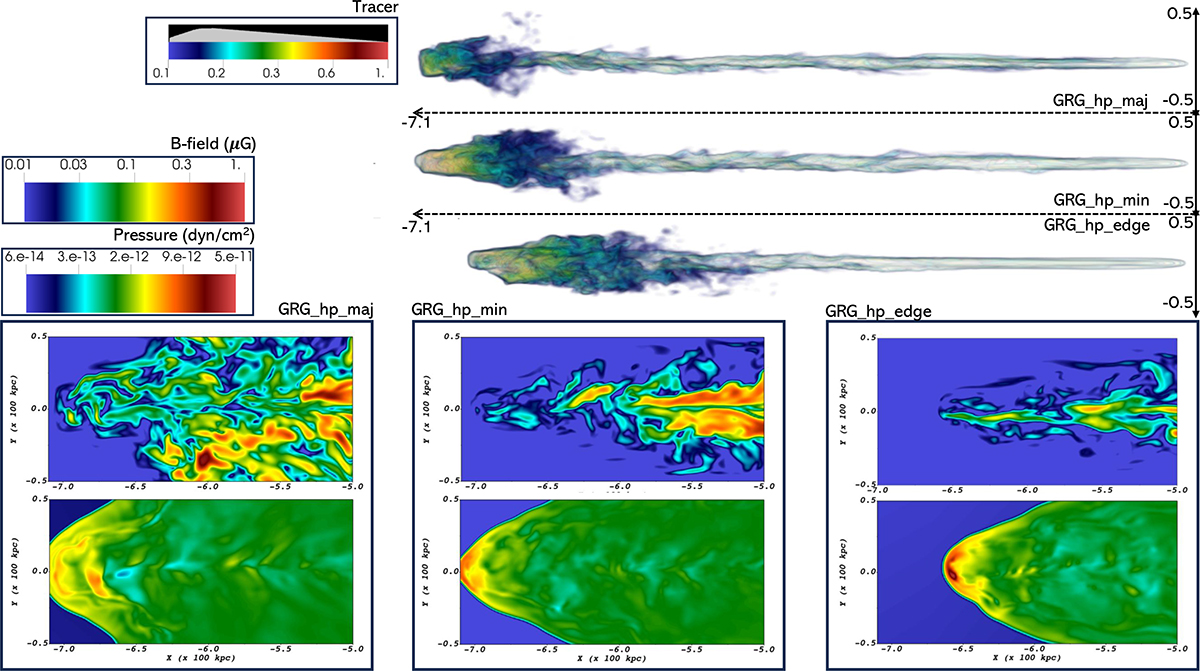
Fig. 7.
Download original image
Dynamic maps illustrating the jet spine and head structures, elucidating the absence of prominent hotspots in our synthetic emission maps for high-power jet simulations. The top panel presents a 3D volume-rendered visualization of the jet tracer, highlighting the jet beam – jet head morphology at their corresponding evolutionary ages. The bottom panel shows 2D slices focused on the jet head: the top row maps the magnetic field magnitude, while the bottom row maps the pressure distribution. These maps reveal that although the jet sustains its thrust up to the terminal shock, the magnetic field strength drops sharply at this region – largely advected away by the backflowing plasma – thereby suppressing the formation of bright hotspots.
Current usage metrics show cumulative count of Article Views (full-text article views including HTML views, PDF and ePub downloads, according to the available data) and Abstracts Views on Vision4Press platform.
Data correspond to usage on the plateform after 2015. The current usage metrics is available 48-96 hours after online publication and is updated daily on week days.
Initial download of the metrics may take a while.