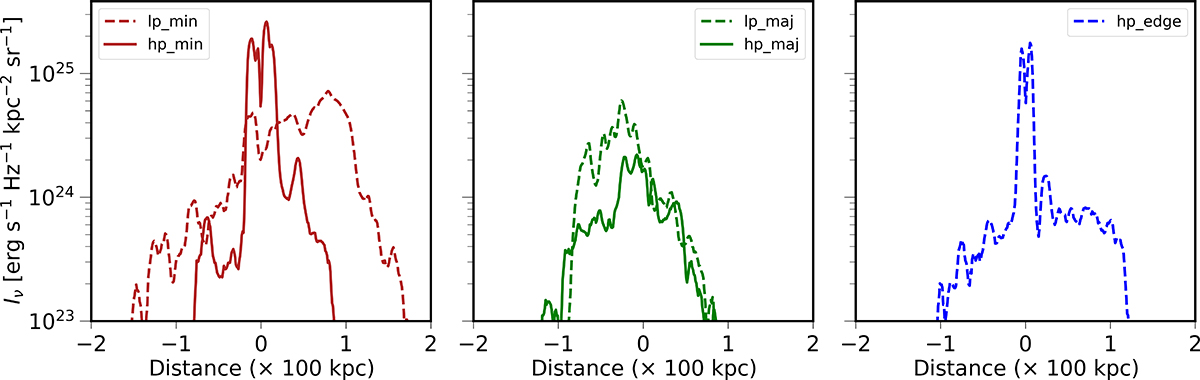
Fig. 8.
Download original image
Lateral intensity variation measured at the maximum cocoon width for five simulation scenarios (Fig. 4(A−C)), providing a quantitative assessment of intensity distribution and identifying active zones within the cocoon. Subplots correspond to different simulation runs categorized by ‘min’, ‘maj’, and ‘edge’ cases, enabling a comparison of jet power on cocoon activity and evolution.
Current usage metrics show cumulative count of Article Views (full-text article views including HTML views, PDF and ePub downloads, according to the available data) and Abstracts Views on Vision4Press platform.
Data correspond to usage on the plateform after 2015. The current usage metrics is available 48-96 hours after online publication and is updated daily on week days.
Initial download of the metrics may take a while.