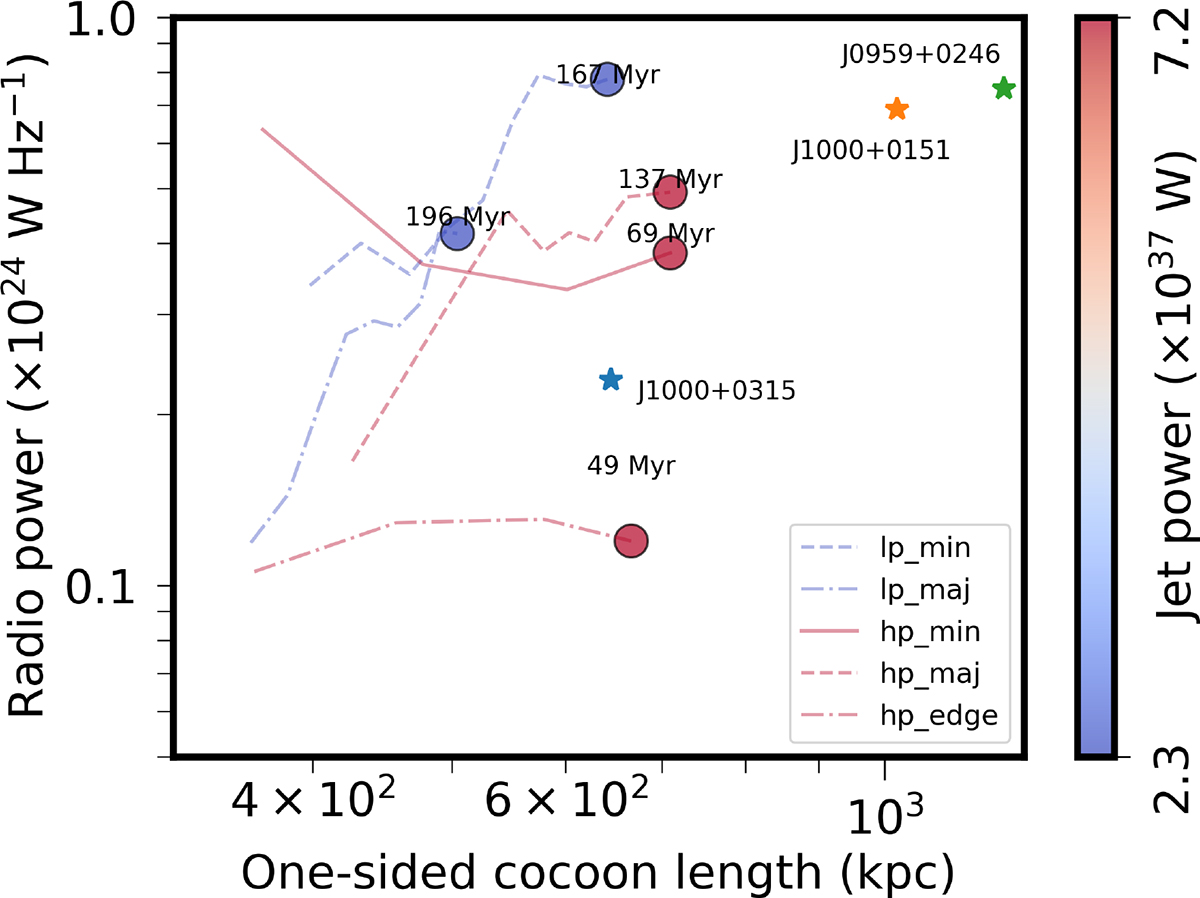
Fig. 9.
Download original image
Radio power at 1 GHz of the (one-sided) cocoon versus (one-sided) cocoon length, presented at the evolved stages (dynamical ages attached) of the simulated GRGs. Two jet power values used in the simulations are also highlighted, in blue and red. The evolutionary track of the simulated GRGs in the Power-Distance (P-D) diagram is also shown from the point they exceed 350 kpc, qualifying as GRGs in their total extent. For reference, we include measurements of three observed GRGs from Charlton et al. (2024) in similar observing band, representing a typical one-half estimation. We note that the above calculation does not explicitly account for the cooling effects.
Current usage metrics show cumulative count of Article Views (full-text article views including HTML views, PDF and ePub downloads, according to the available data) and Abstracts Views on Vision4Press platform.
Data correspond to usage on the plateform after 2015. The current usage metrics is available 48-96 hours after online publication and is updated daily on week days.
Initial download of the metrics may take a while.