Fig. 1
Download original image
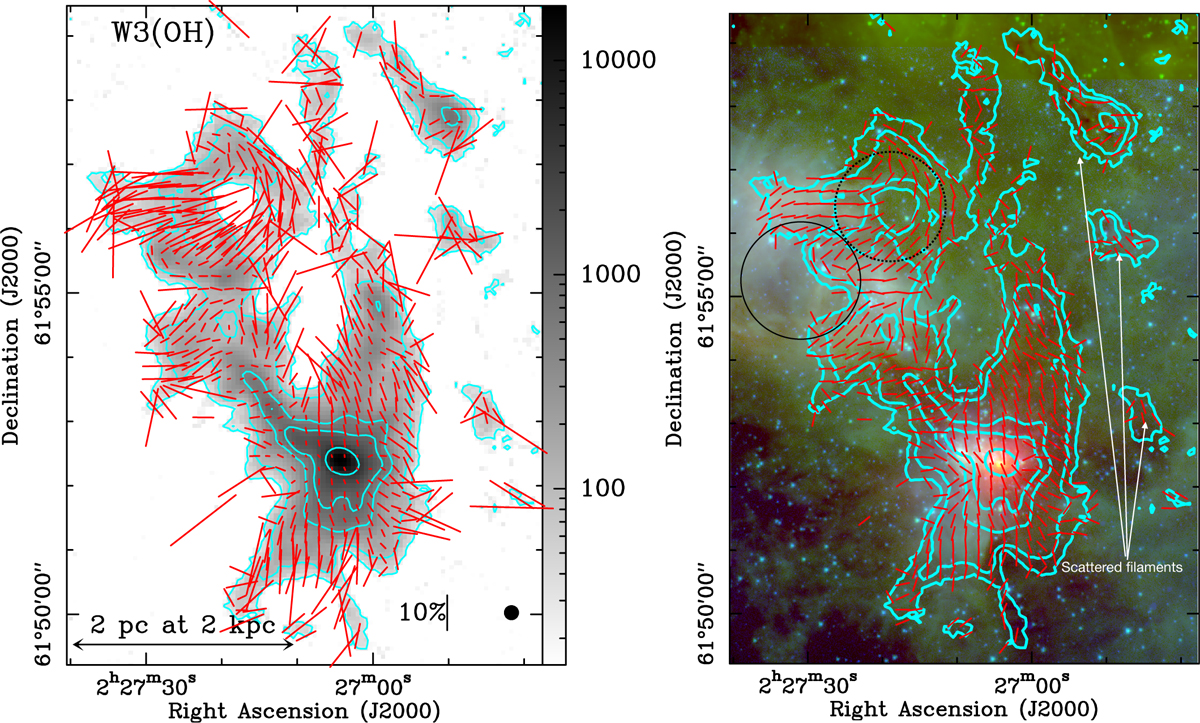
Left: total intensity Stokes I map at 850 µm observed with the JCMT SCUBA-2/POL-2 towards W3(OH) in units of mJy beam−1. The contours are I = 30, 100, 500, 1000, and 5000 mJybeam−1. The lowest contour of I = 30 mJybeam−1 is equivalent to I/δI ~ 13. The red lines show the orientation of the POS B-field angle (![]() ) for I/δI > 5, PI/δPI > 1, and PF < 25%. The lengths of the red lines are proportional to PF. A line showing PF = 10% is indicated on the plot. The data are at an angular resolution of 14″ or ~0.14 pc at the 2 kpc distance of the source. Right: contours and red lines are the same as in the left panel. The red lines are plotted with the same length to better show the B-field orientation. The background is a colour image composed using Spitzer 3.6 µm, 4.5 µm, and 8.0 µm images for the blue, green, and red, respectively.
) for I/δI > 5, PI/δPI > 1, and PF < 25%. The lengths of the red lines are proportional to PF. A line showing PF = 10% is indicated on the plot. The data are at an angular resolution of 14″ or ~0.14 pc at the 2 kpc distance of the source. Right: contours and red lines are the same as in the left panel. The red lines are plotted with the same length to better show the B-field orientation. The background is a colour image composed using Spitzer 3.6 µm, 4.5 µm, and 8.0 µm images for the blue, green, and red, respectively.
Current usage metrics show cumulative count of Article Views (full-text article views including HTML views, PDF and ePub downloads, according to the available data) and Abstracts Views on Vision4Press platform.
Data correspond to usage on the plateform after 2015. The current usage metrics is available 48-96 hours after online publication and is updated daily on week days.
Initial download of the metrics may take a while.