Fig. 11
Download original image
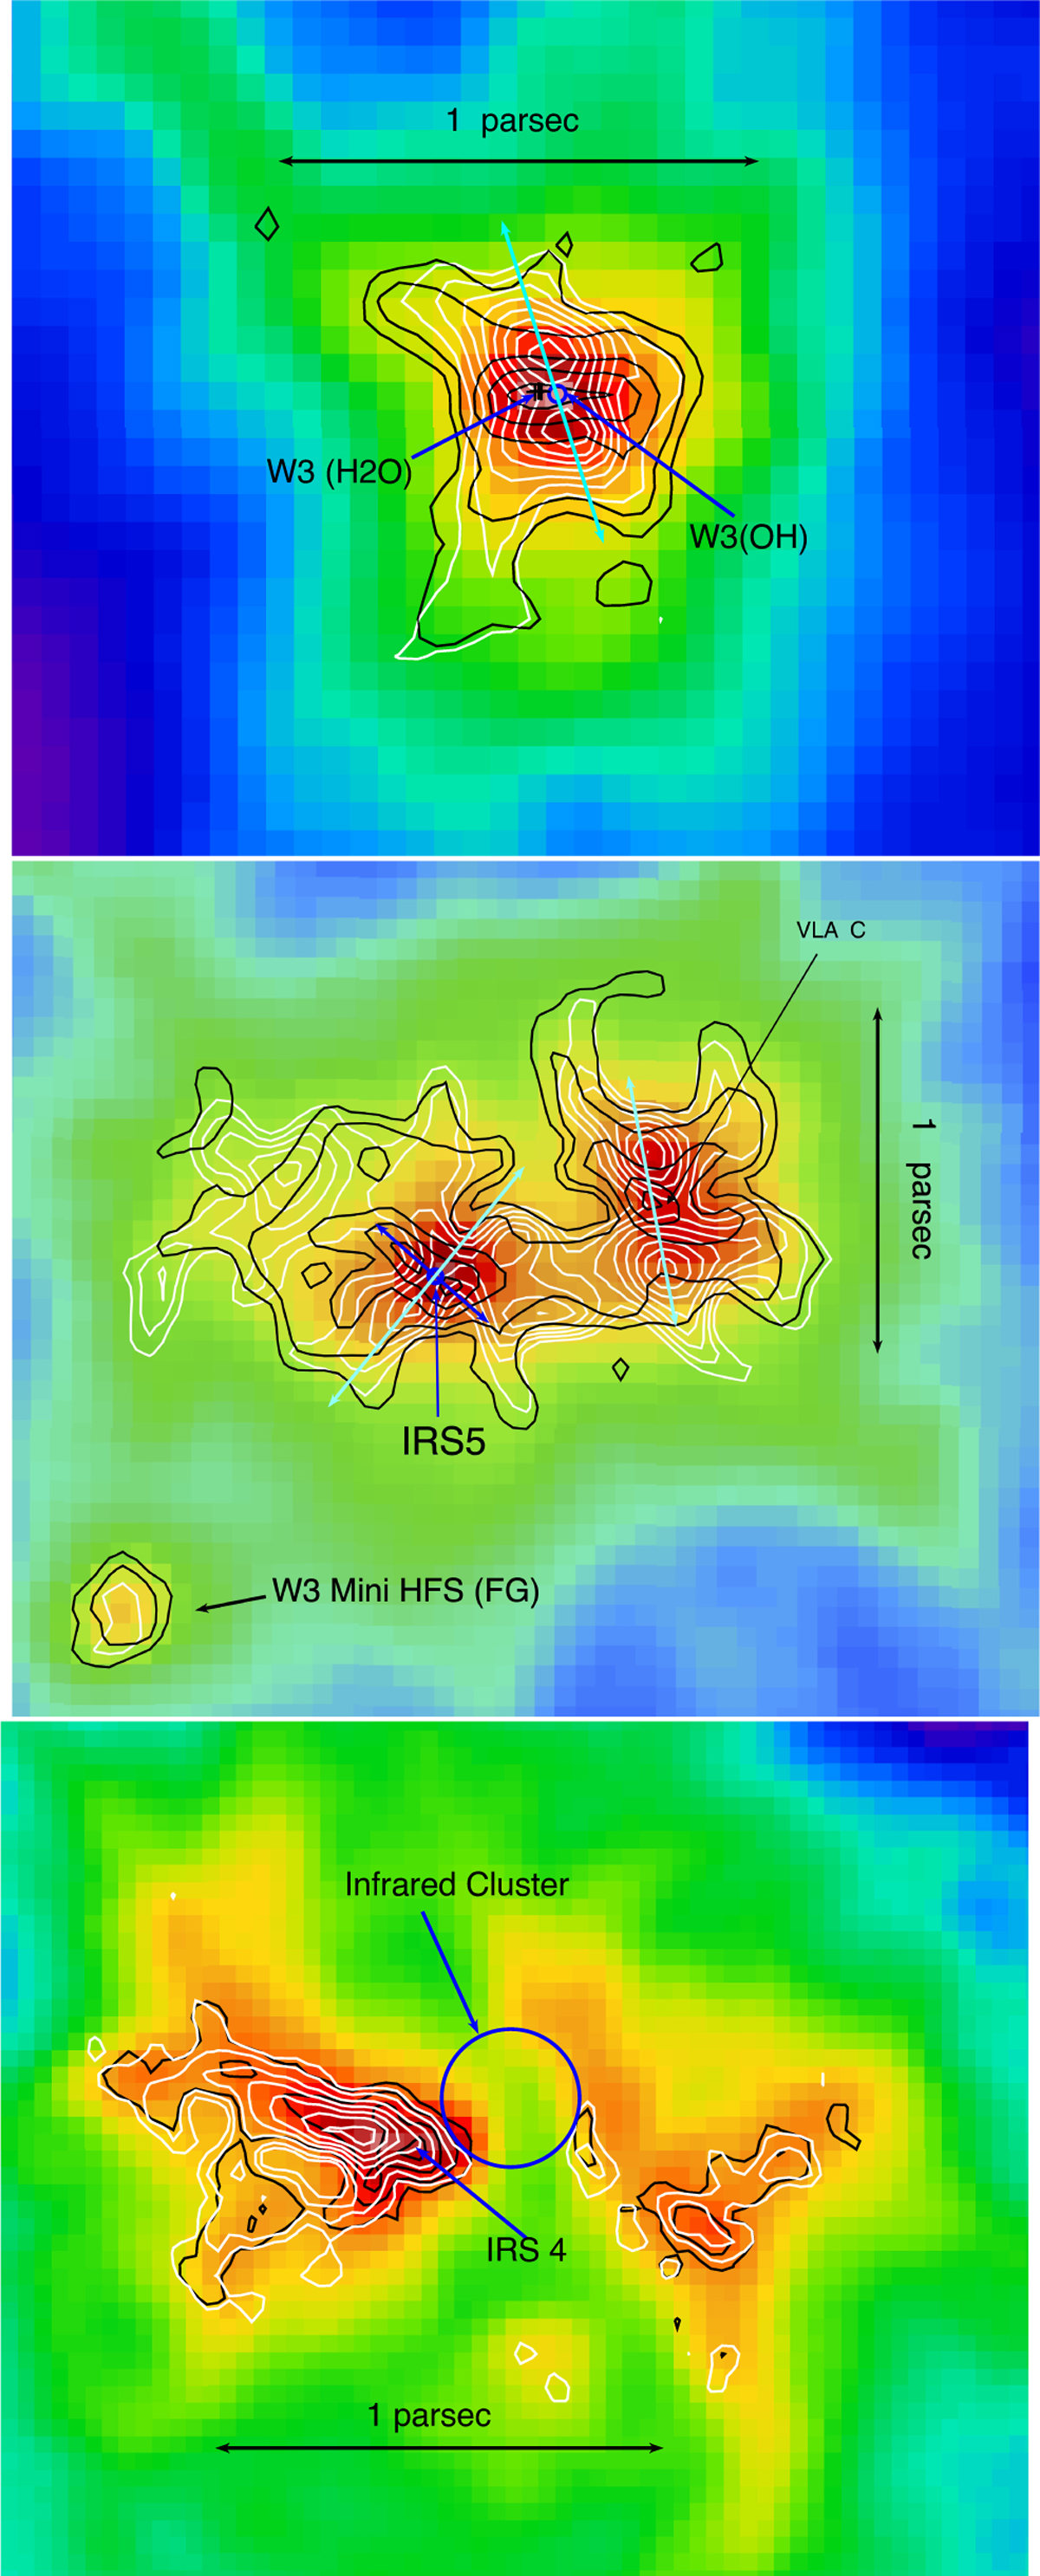
Clockwise from top left: spatial correlation between total intensity, PF, and PI in W3(OH), W3 Main, and S 106 displayed over Herschel SPIRE 250 µm image. Black contours represent 1/PF with levels 0.25, 0.5, 1, 1.5, and 2 (for W3(OH) and W3 Main, top) and 0.1, 0.3, 0.6, and 0.9 (for S 106, bottom). White contours display PI with levels from 20 to 90 mJy/beam in intervals of 10 mJy/beam for W3(OH) and W3 Main (top), and levels 5, 10, 20, 30, 40, 50, and 60 mJy/beam for S 106 (bottom). The cyan vectors in the top two panels mark bipolar patterns in PI that correspond to outflows (see Sect. 5.2). The blue vector in W3 Main identifies the low PF elongated structure centred on IRS 5. This is similar to the elongated disc structure in W3(OH) traced by 1/PF contours.
Current usage metrics show cumulative count of Article Views (full-text article views including HTML views, PDF and ePub downloads, according to the available data) and Abstracts Views on Vision4Press platform.
Data correspond to usage on the plateform after 2015. The current usage metrics is available 48-96 hours after online publication and is updated daily on week days.
Initial download of the metrics may take a while.