Open Access
Fig. 13
Download original image
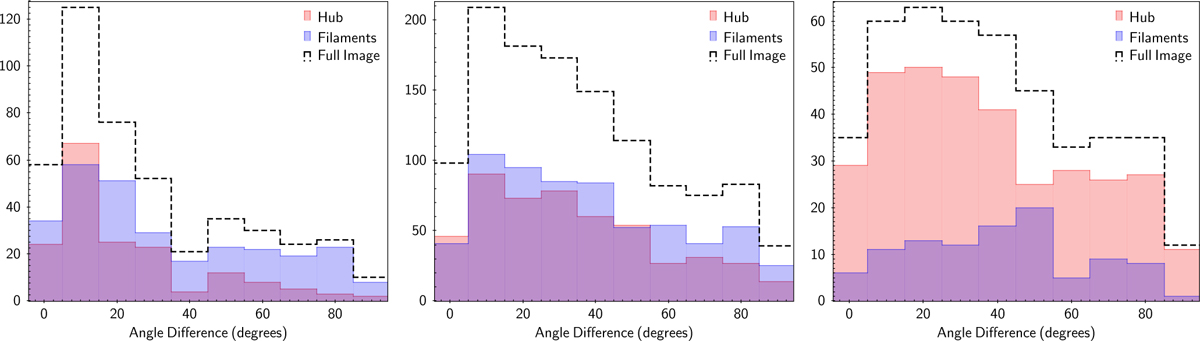
Histograms of the difference between the filament orientation and ![]() for the total (black), hub (red), and filament (blue) regions, for W3(OH), W3-Main, and S 106 from left to right. The vertical axes indicate the pixel number. Here, pixels with the error on
for the total (black), hub (red), and filament (blue) regions, for W3(OH), W3-Main, and S 106 from left to right. The vertical axes indicate the pixel number. Here, pixels with the error on ![]() smaller than 20 degrees are chosen.
smaller than 20 degrees are chosen.
Current usage metrics show cumulative count of Article Views (full-text article views including HTML views, PDF and ePub downloads, according to the available data) and Abstracts Views on Vision4Press platform.
Data correspond to usage on the plateform after 2015. The current usage metrics is available 48-96 hours after online publication and is updated daily on week days.
Initial download of the metrics may take a while.