Fig. A.1
Download original image
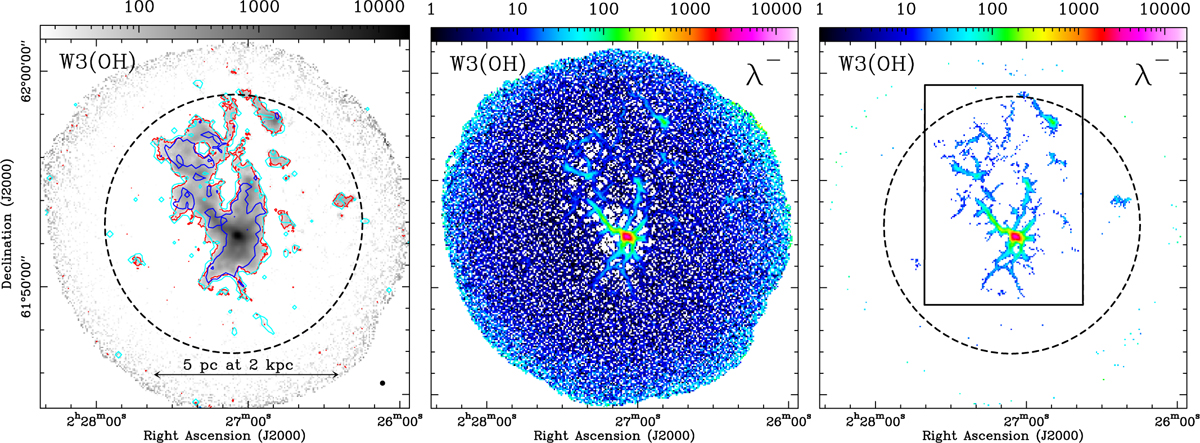
Left: Stokes I map at 850 µm observed with the JCMT POL-2 towards W3(OH) in unit of mJy beam−1. The HPBW resolution of the maps shown on this figure is 14″ and the pixel size is 4″. The red contours correspond to I/δI > 5. The cyan and blue contours correspond to PI/δPI > 1 and PI/δPI > 5, respectively. The black dashed circle have a diameter of 12′. Middle: The minimum curvature map (in unit of mJy beam−1) of W3(OH) derived from the Stokes I map. Right: W3(OH) minimum curvature map (in unit of mJy beam−1) of W3(OH) where pixels with I/δI < 5 are masked. The filamentary structures are enhanced by the minimum curvature map. The black rectangle is the field shown in Fig. 1. The dashed circle is the same as on the left panel.
Current usage metrics show cumulative count of Article Views (full-text article views including HTML views, PDF and ePub downloads, according to the available data) and Abstracts Views on Vision4Press platform.
Data correspond to usage on the plateform after 2015. The current usage metrics is available 48-96 hours after online publication and is updated daily on week days.
Initial download of the metrics may take a while.