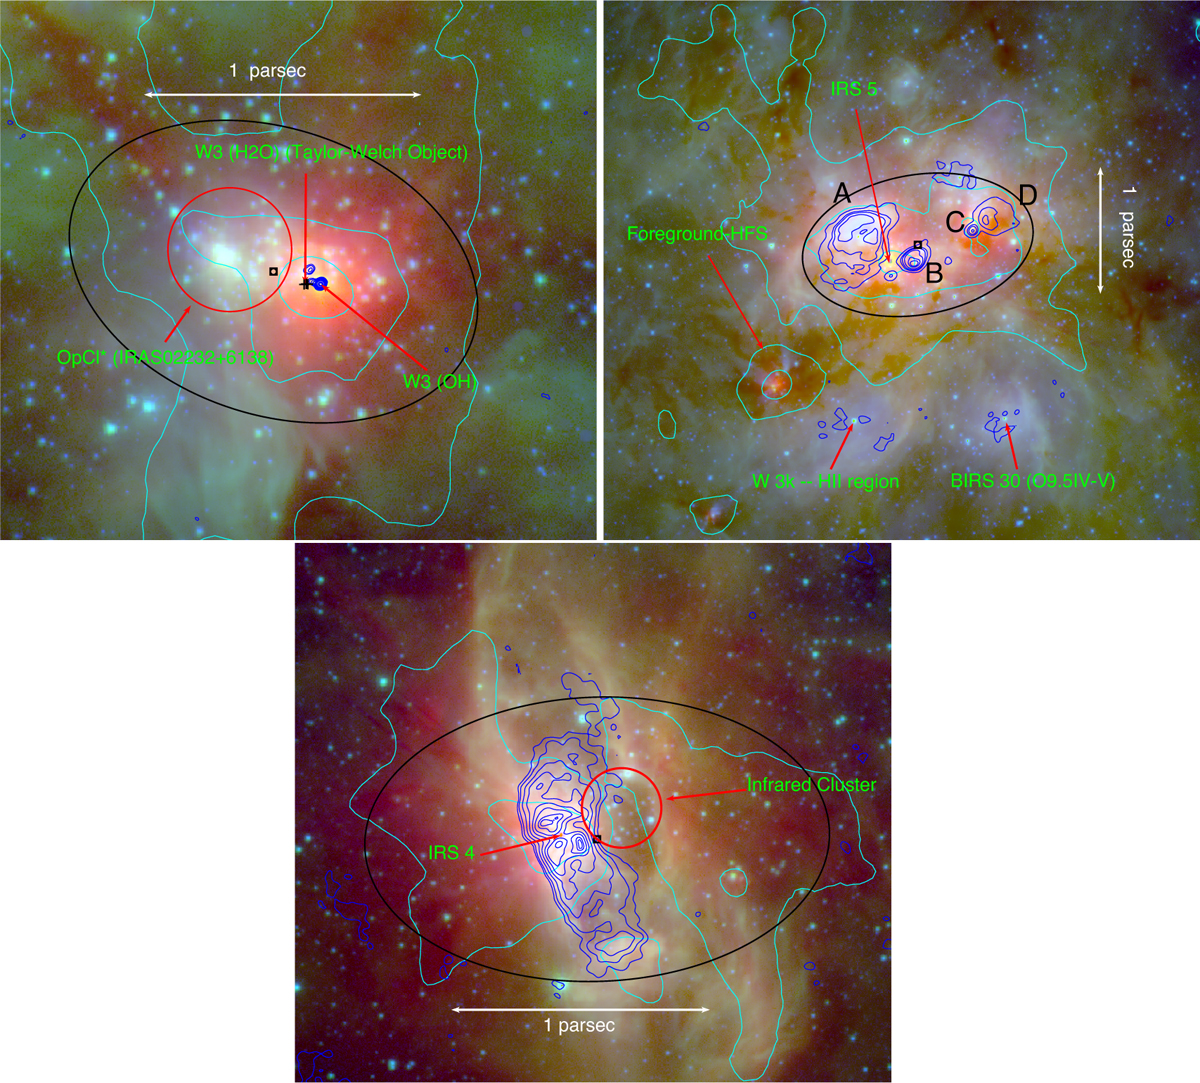
Fig. 5
Download original image
Hub regions of W3(OH), W3-Main, and S106 (clockwise from top left). The colour compositions are the same as the right panels of Figs. 1, 2, and 3. Here the cyan contours trace column densities of 1022, 1023 , and 5×1023 cm−2. The black ellipses represent the hubs as described in Table 1, and their centres are marked with a black box-circle symbol. The blue contours represent VLA 4.89 GHz continuum emission obtained in B/C configurations. This emission is shown with a beam size of 0.7″ for W3(OH), however, it is compact at the scale of 0.08″. In the ‘two node’ system, the OpCl* (Carpenter et al. 2000) represents the more evolved node compared to the younger node composed of W3(H2O) and W3(OH) (e.g. Qin et al. 2016; Wyrowski et al. 1999). In W3-Main, IRS 5 surrounded by compact HII regions (Tieftrunk et al. 1997) A & B represent the younger node, while the evolved node corresponds to the compact regions C & D. In S 106, the younger and older nodes correspond to IRS 4 and the infrared cluster, respectively (Saito et al. 2009).
Current usage metrics show cumulative count of Article Views (full-text article views including HTML views, PDF and ePub downloads, according to the available data) and Abstracts Views on Vision4Press platform.
Data correspond to usage on the plateform after 2015. The current usage metrics is available 48-96 hours after online publication and is updated daily on week days.
Initial download of the metrics may take a while.