Fig. 4
Download original image
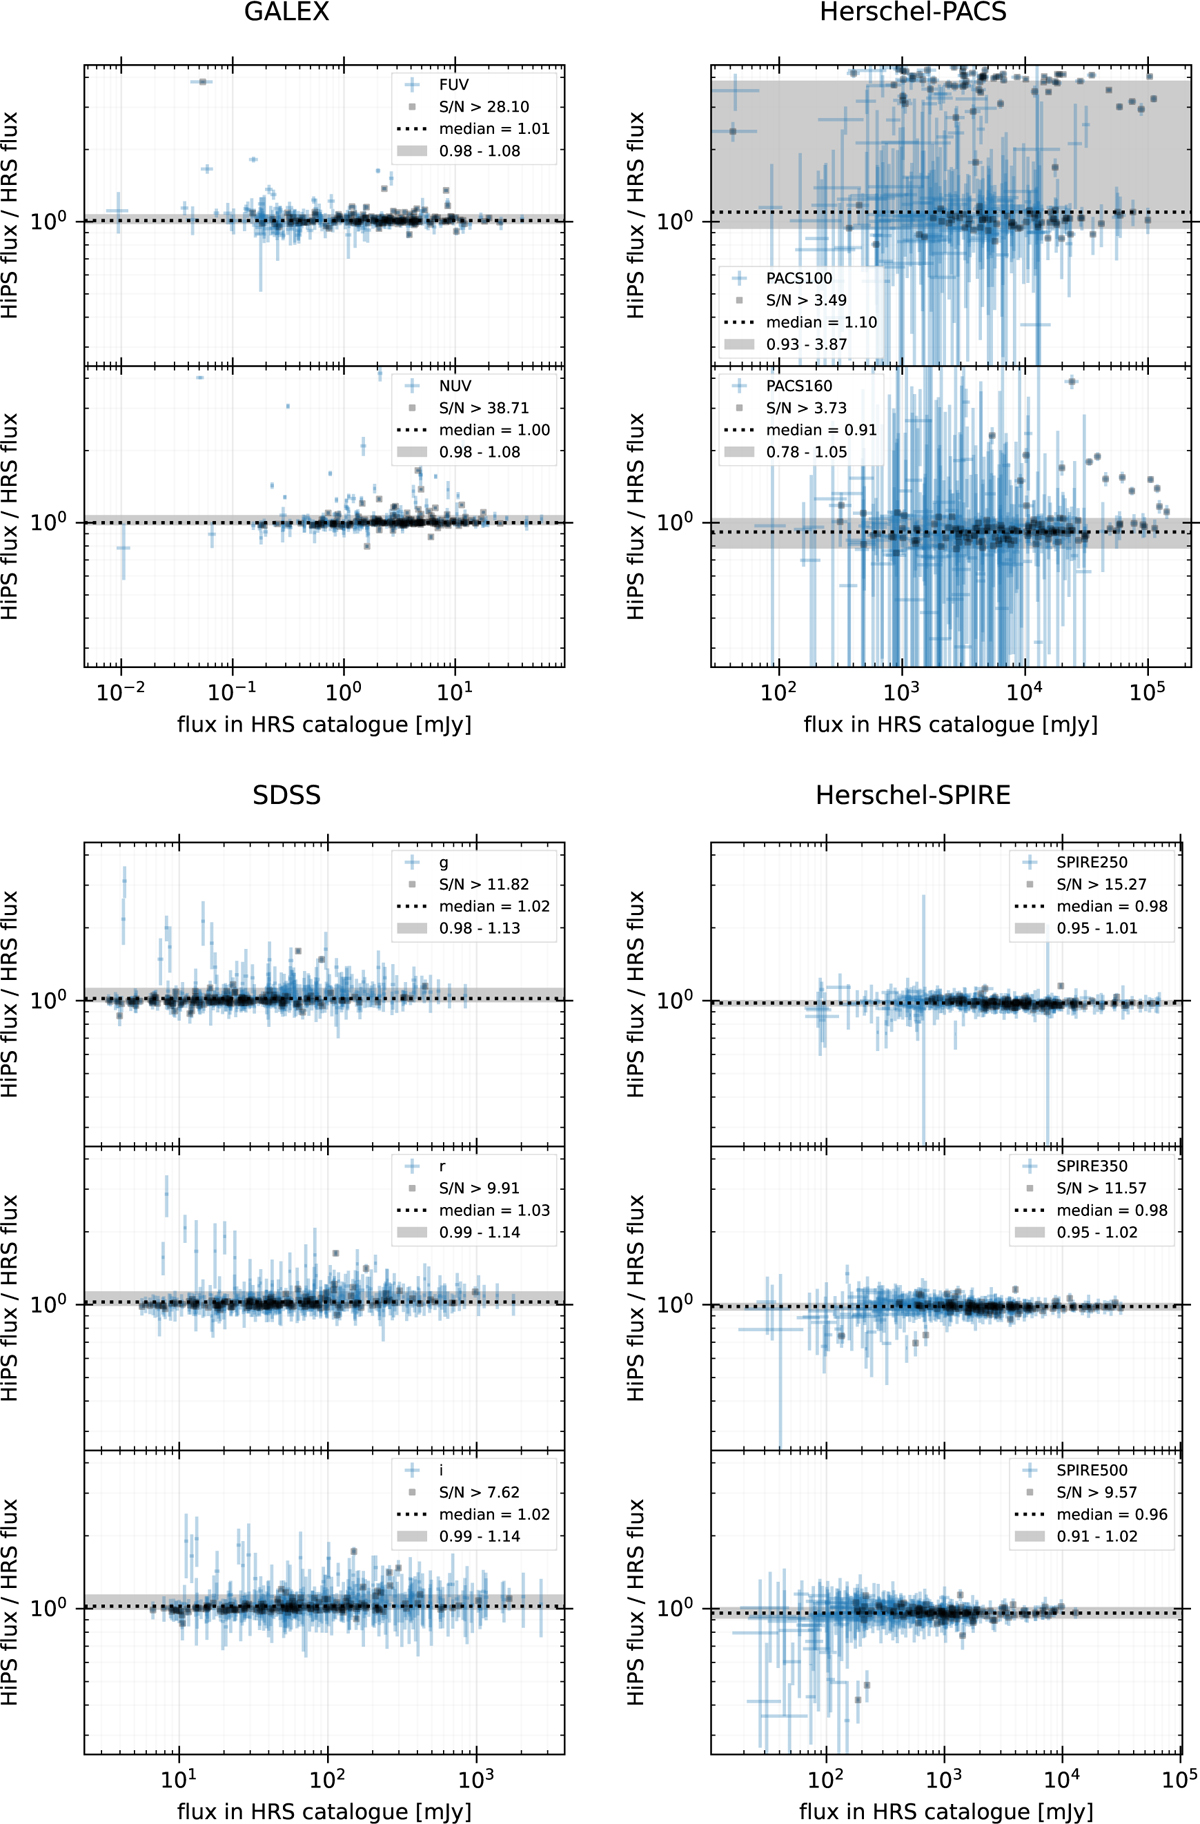
Comparison between the flux measured from the HiPS skymaps and the values reported in the HRS catalogues for GALEX (Cortese et al. 2012, top left), SDSS (Cortese et al. 2012, bottom left), and Herschel (Ciesla et al. 2012; Cortese et al. 2014, top and bottom right for the PACS and SPIRE instruments, respectively). Error bars in the vertical axis represent the uncertainties returned by our pipeline (they do not include HRS errors); measurements above the median S/N are highlighted in black. Horizontal dotted lines and grey bands denote the median and 16–84 percentiles of the flux ratio (see Figure 5 for the full probability distribution).
Current usage metrics show cumulative count of Article Views (full-text article views including HTML views, PDF and ePub downloads, according to the available data) and Abstracts Views on Vision4Press platform.
Data correspond to usage on the plateform after 2015. The current usage metrics is available 48-96 hours after online publication and is updated daily on week days.
Initial download of the metrics may take a while.