Fig. 11.
Download original image
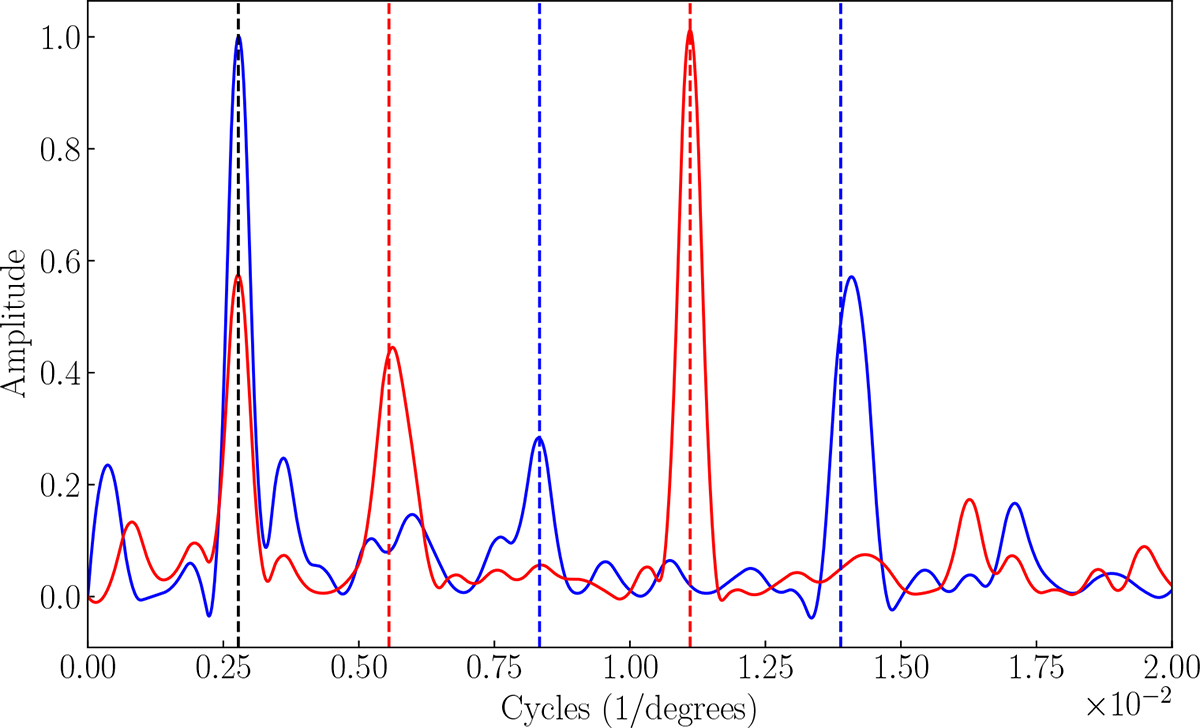
Results of the Fourier analysis on the RM data of the different sectors presented in Figure 7. The blue curve represents the FT of the original RM data. The red curve represents the FT of the geometrically modified RM data as described in Section 4.1. Each dashed line shows the exact position of integers divided by 360°. The black dashed line shows 1/360, the red dashed line shows 2/360 and 4/360, and the blue dashed line shows 3/360 and 5/360.
Current usage metrics show cumulative count of Article Views (full-text article views including HTML views, PDF and ePub downloads, according to the available data) and Abstracts Views on Vision4Press platform.
Data correspond to usage on the plateform after 2015. The current usage metrics is available 48-96 hours after online publication and is updated daily on week days.
Initial download of the metrics may take a while.