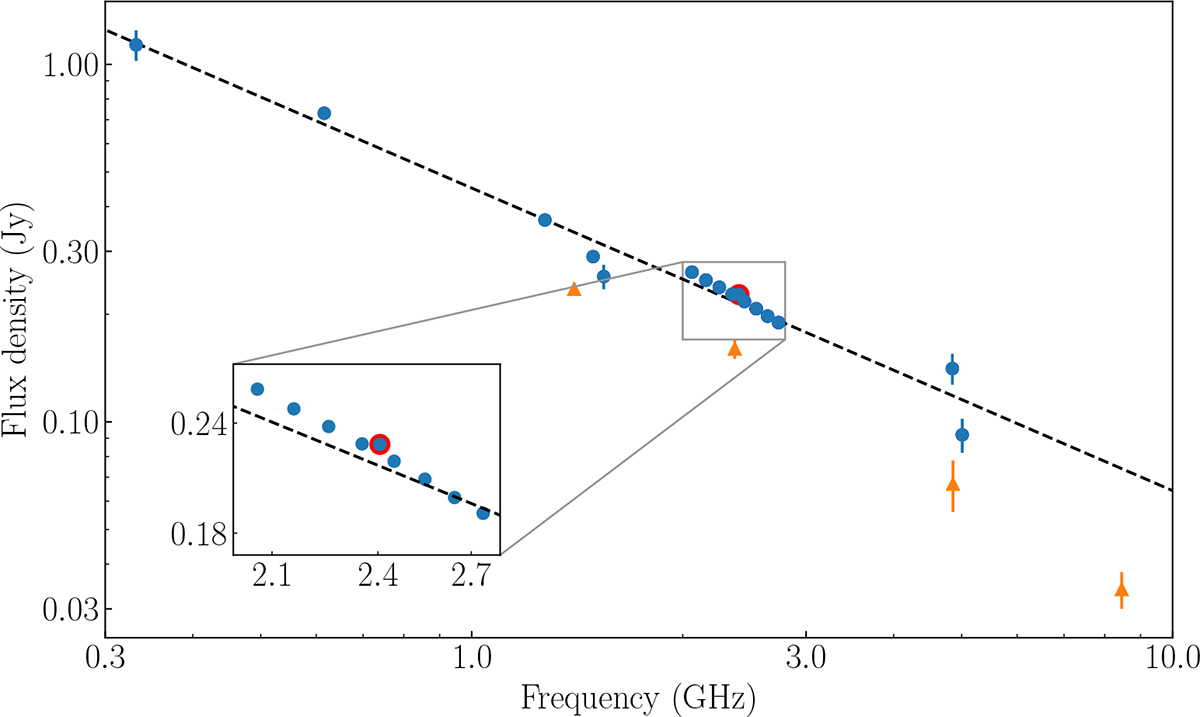
Fig. 2.
Download original image
Total flux density of different observations of NGC 2997 compared to the MeerKAT S-band observations. The points represent observations listed in Table 3. Blue circles in this plot correspond to studies that fully recover the extended emission of the source. These data points were used to estimate the spectral index of the total flux densities. This linear fit is represented by the black dashed line. Orange triangles represent observations that did not fully recover the extended emission of the source. These data points were not included in the fit. Inset: Total intensity emission (robust 0 weighting) in 8 spectral windows. The maps in each spectral window were smoothed to the resolution at the lowest frequency and corrected with the corresponding primary beam model. The blue circles represent the flux density integrated over the whole galaxy, integrated out to a radius of 250″. The red circle represents the integrated flux density over the whole bandwidth. The rms per spectral window is about 40 μJy beam−1 which gives a flux density error of about 1 mJy, similar to the symbol size. The general uncertainty of the absolute calibration scale of about 3% is not included in this plot.
Current usage metrics show cumulative count of Article Views (full-text article views including HTML views, PDF and ePub downloads, according to the available data) and Abstracts Views on Vision4Press platform.
Data correspond to usage on the plateform after 2015. The current usage metrics is available 48-96 hours after online publication and is updated daily on week days.
Initial download of the metrics may take a while.