Fig. 5.
Download original image
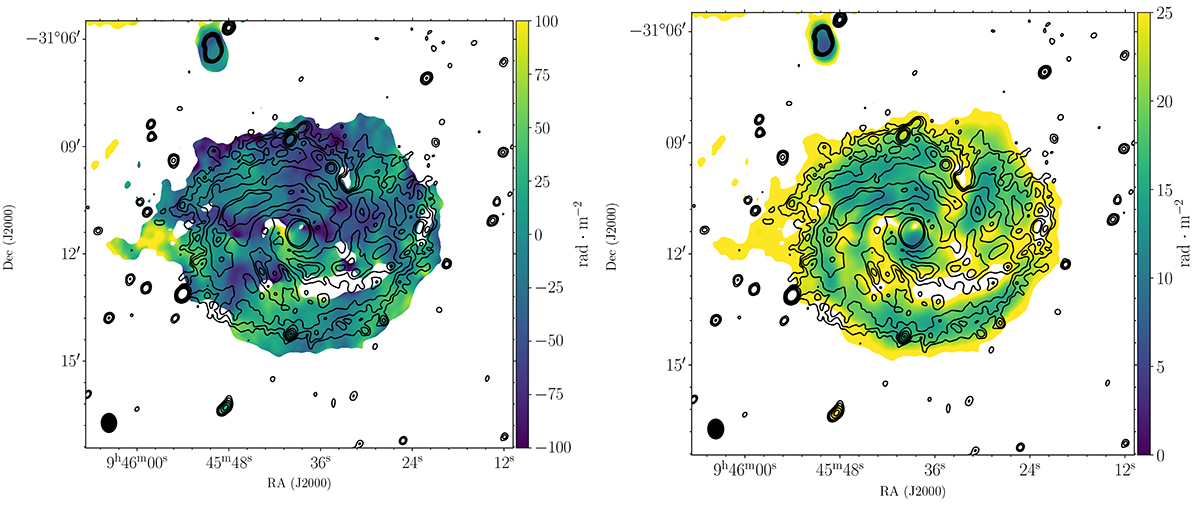
Left: Total radio intensity contours on top of a color scale map of the RMs after applying RM synthesis. The scales are in rad m−2. The contour levels are (3, 5, 8, 16, 32, and 50) × 15.5 μJy beam−1 at a resolution of 32″ × 26″. The foreground RM of our Galaxy has not been subtracted. Right: Same total intensity contours as in the left panel on top of the RM error map. The beam size is shown at the bottom left corner of each image. A cut-off of 5 × rms noise is applied to all these maps. Regions close to the minor axis of the disk are excluded due to unrealistic RM values.
Current usage metrics show cumulative count of Article Views (full-text article views including HTML views, PDF and ePub downloads, according to the available data) and Abstracts Views on Vision4Press platform.
Data correspond to usage on the plateform after 2015. The current usage metrics is available 48-96 hours after online publication and is updated daily on week days.
Initial download of the metrics may take a while.