Fig. 7.
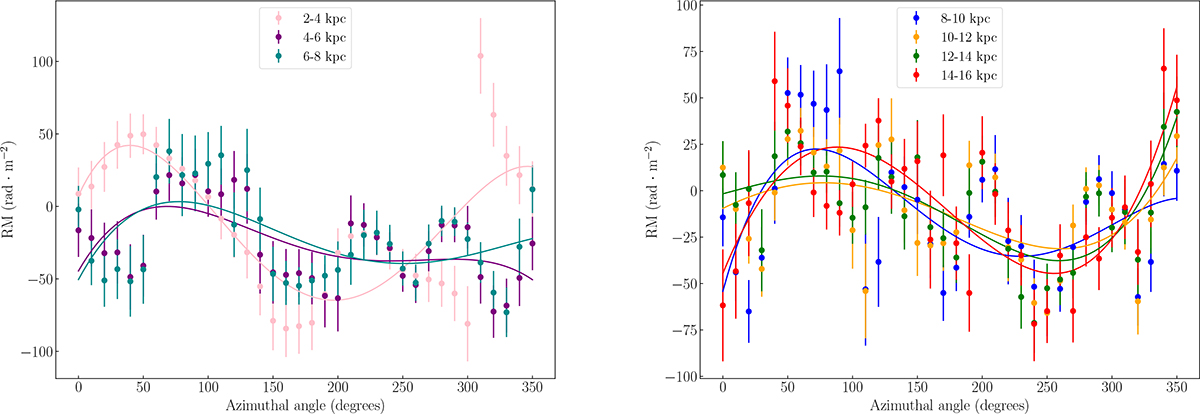
Download original image
Sector analysis of RMs in different rings, as described in Section 3.3. Each color represents a different ring. Data points and estimated error bars are shown with the same color in each ring. Solid lines show fourth-order polynomial functions. The first ring starts between 2 kpc and 4 kpc from the center in the plane of the galaxy, and subsequent rings are placed every 2 kpc. The last ring is placed between 14 kpc and 16 kpc where the polarization emission reaches three times the signal-to-noise ratio (S/N) value. Each ring is divided into multiple sectors separated by 10° in azimuthal angle. Sectors start at 0° on the south-eastern major axis of the galaxy on the plane of the sky and increase counter-clockwise. The plot was divided for a better visualization: The left panel shows rings from 2 to 8 kpc and the right panel shows rings from 8 to 16 kpc.
Current usage metrics show cumulative count of Article Views (full-text article views including HTML views, PDF and ePub downloads, according to the available data) and Abstracts Views on Vision4Press platform.
Data correspond to usage on the plateform after 2015. The current usage metrics is available 48-96 hours after online publication and is updated daily on week days.
Initial download of the metrics may take a while.