Fig. C.1.
Download original image
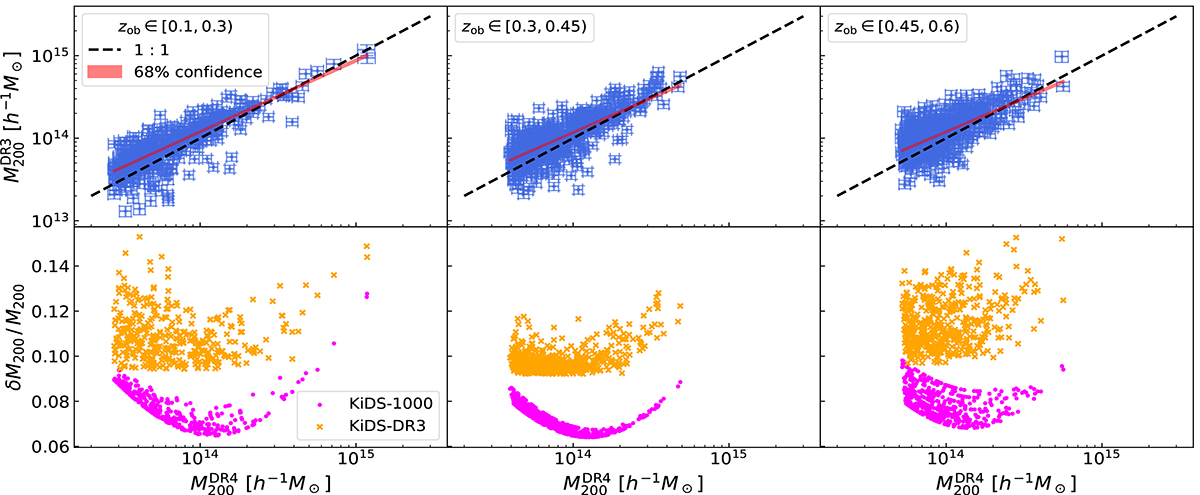
Comparison between ![]() and
and ![]() for zob ∈ [0.1, 0.3) (left panels), zob ∈ [0.3, 0.45) (middle panels), and zob ∈ [0.45, 0.6) (right panels), applying the λob* cuts listed in Table 1 to the AMICO KiDS-1000 cluster sample. Top panels: Mean
for zob ∈ [0.1, 0.3) (left panels), zob ∈ [0.3, 0.45) (middle panels), and zob ∈ [0.45, 0.6) (right panels), applying the λob* cuts listed in Table 1 to the AMICO KiDS-1000 cluster sample. Top panels: Mean ![]() against the mean
against the mean ![]() . The error bars are derived by marginalising the mass estimates over all the free model parameter posteriors. The dashed black lines represent the 1:1 relation, while the red bands represent the 68% confidence of the linear model used for the fit. Bottom panels: Mass precision in KiDS-DR4 (magenta dots) and in KiDS-DR3 (orange crosses).
. The error bars are derived by marginalising the mass estimates over all the free model parameter posteriors. The dashed black lines represent the 1:1 relation, while the red bands represent the 68% confidence of the linear model used for the fit. Bottom panels: Mass precision in KiDS-DR4 (magenta dots) and in KiDS-DR3 (orange crosses).
Current usage metrics show cumulative count of Article Views (full-text article views including HTML views, PDF and ePub downloads, according to the available data) and Abstracts Views on Vision4Press platform.
Data correspond to usage on the plateform after 2015. The current usage metrics is available 48-96 hours after online publication and is updated daily on week days.
Initial download of the metrics may take a while.