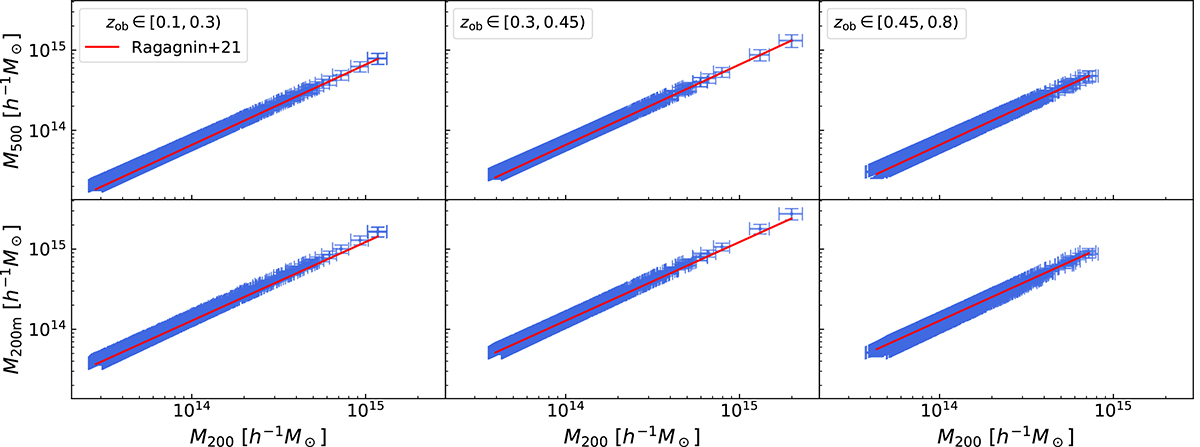
Fig. D.1.
Download original image
M500 (top panels) and M200m (bottom panels) compared against M200, for zob ∈ [0.1, 0.3) (left panels), zob ∈ [0.3, 0.45) (middle panels), and zob ∈ [0.45, 0.8) (right panels), applying the λob* cuts listed in Table 1. The blue dots represent the estimates derived in this work, obtained by running the pipeline under the assumption of alternative overdensity definitions. The red lines represent the mass conversion from M200 to a different overdensity based on the theoretical relation by Ragagnin et al. (2021).
Current usage metrics show cumulative count of Article Views (full-text article views including HTML views, PDF and ePub downloads, according to the available data) and Abstracts Views on Vision4Press platform.
Data correspond to usage on the plateform after 2015. The current usage metrics is available 48-96 hours after online publication and is updated daily on week days.
Initial download of the metrics may take a while.