Open Access
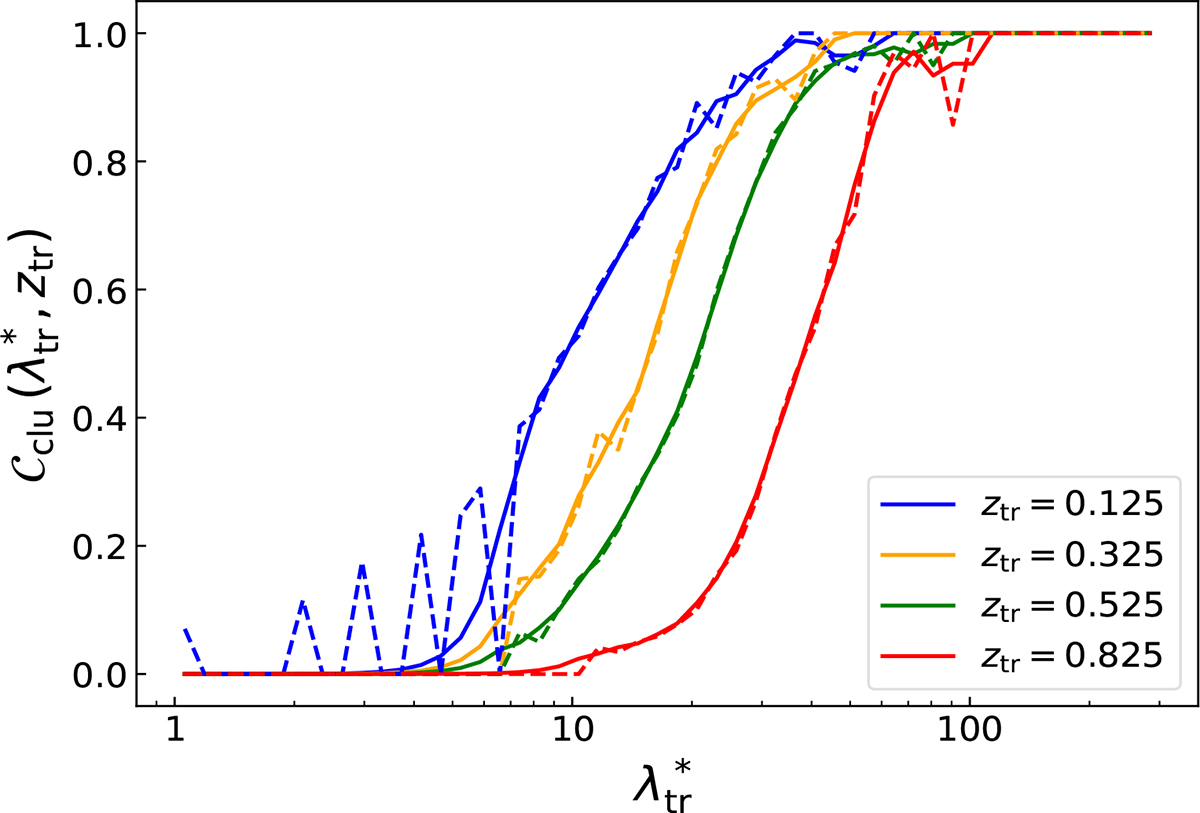
Fig. 4.
Download original image
Completeness of the cluster sample as a function of λtr*, for some values of ztr (see the legend). Dashed lines display the completeness measurements, while solid lines show the completeness smoothed with Chebyshev polynomials.
Current usage metrics show cumulative count of Article Views (full-text article views including HTML views, PDF and ePub downloads, according to the available data) and Abstracts Views on Vision4Press platform.
Data correspond to usage on the plateform after 2015. The current usage metrics is available 48-96 hours after online publication and is updated daily on week days.
Initial download of the metrics may take a while.