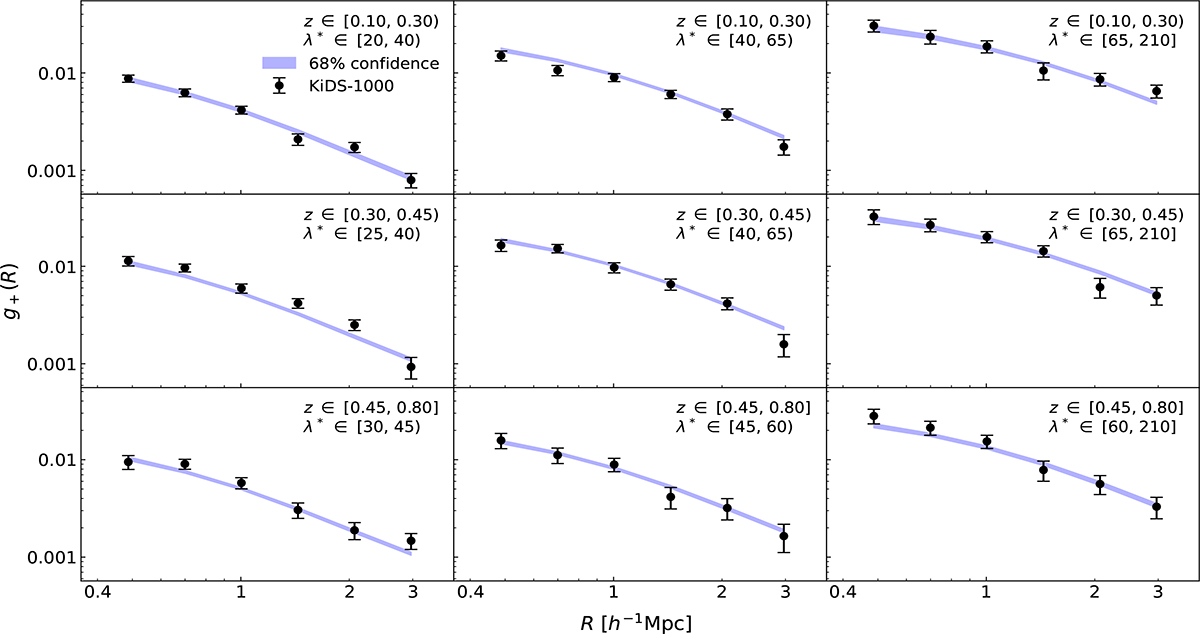
Fig. 6.
Download original image
Stacked g+(R) profiles of the AMICO KiDS-1000 galaxy clusters in bins of z (increasing from top to bottom) and λ* (increasing from left to right). The black dots show the measures, while the error bars are the sum of bootstrap errors and statistical uncertainties coming from systematic errors (see Sect. 5.4). The blue bands represent the 68% confidence levels derived from the multivariate posterior of all the free parameters considered in the joint analysis of counts and weak lensing.
Current usage metrics show cumulative count of Article Views (full-text article views including HTML views, PDF and ePub downloads, according to the available data) and Abstracts Views on Vision4Press platform.
Data correspond to usage on the plateform after 2015. The current usage metrics is available 48-96 hours after online publication and is updated daily on week days.
Initial download of the metrics may take a while.