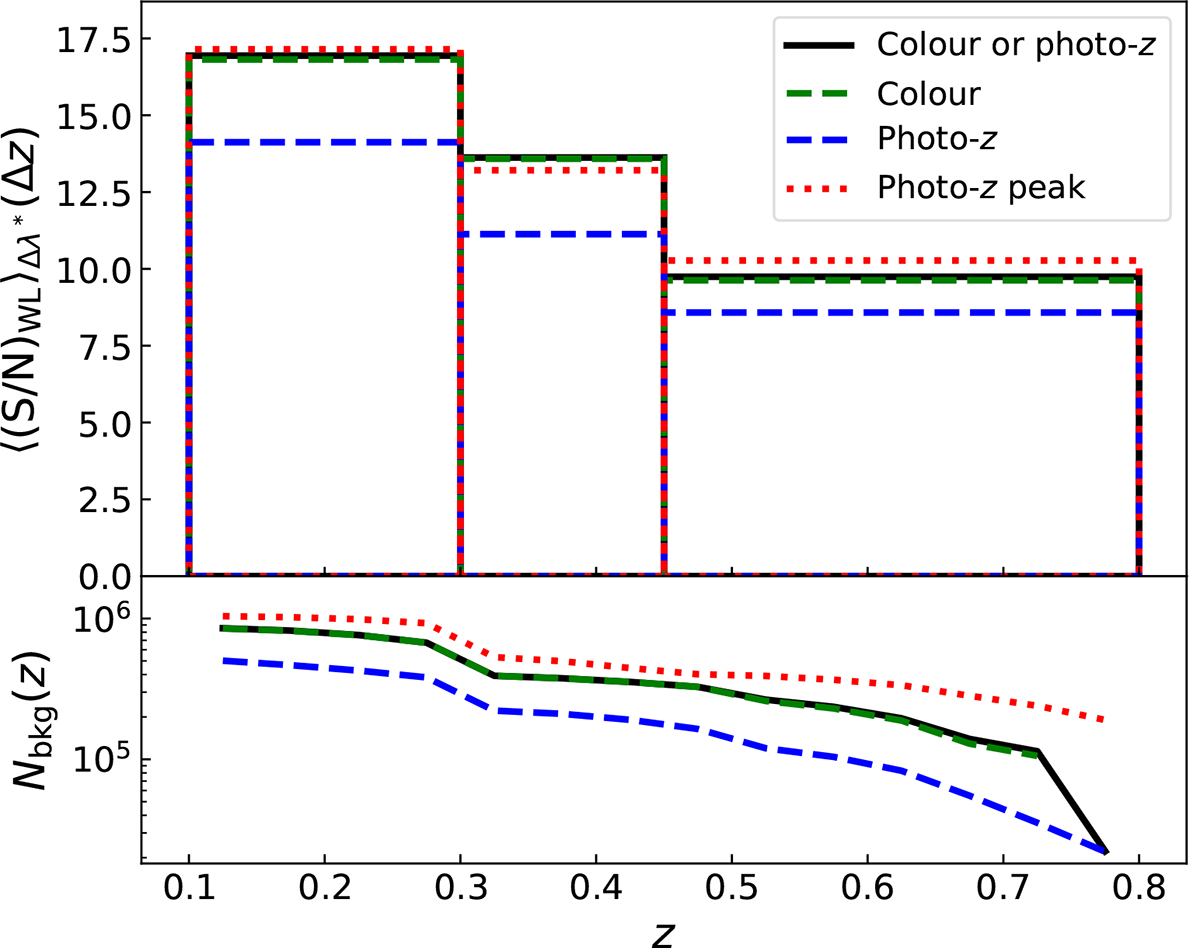
Fig. 7.
Download original image
Top panel: ⟨(S/N)WL⟩Δλ* defined in the cluster redshift bins adopted for the stacking, namely z ∈ [0.1, 0.3), z ∈ [0.3, 0.45), and z ∈ [0.45, 0.8]. Bottom panel: Number of background sources as a function of z. In both panels, quantities obtained from the combination of colour and photo-z selections (solid black lines), colour selection only (dashed green lines), photo-z selection only (dashed blue lines), and photo-z peak selection are shown. The black and green curves are almost overlapping.
Current usage metrics show cumulative count of Article Views (full-text article views including HTML views, PDF and ePub downloads, according to the available data) and Abstracts Views on Vision4Press platform.
Data correspond to usage on the plateform after 2015. The current usage metrics is available 48-96 hours after online publication and is updated daily on week days.
Initial download of the metrics may take a while.