Fig. 1
Download original image
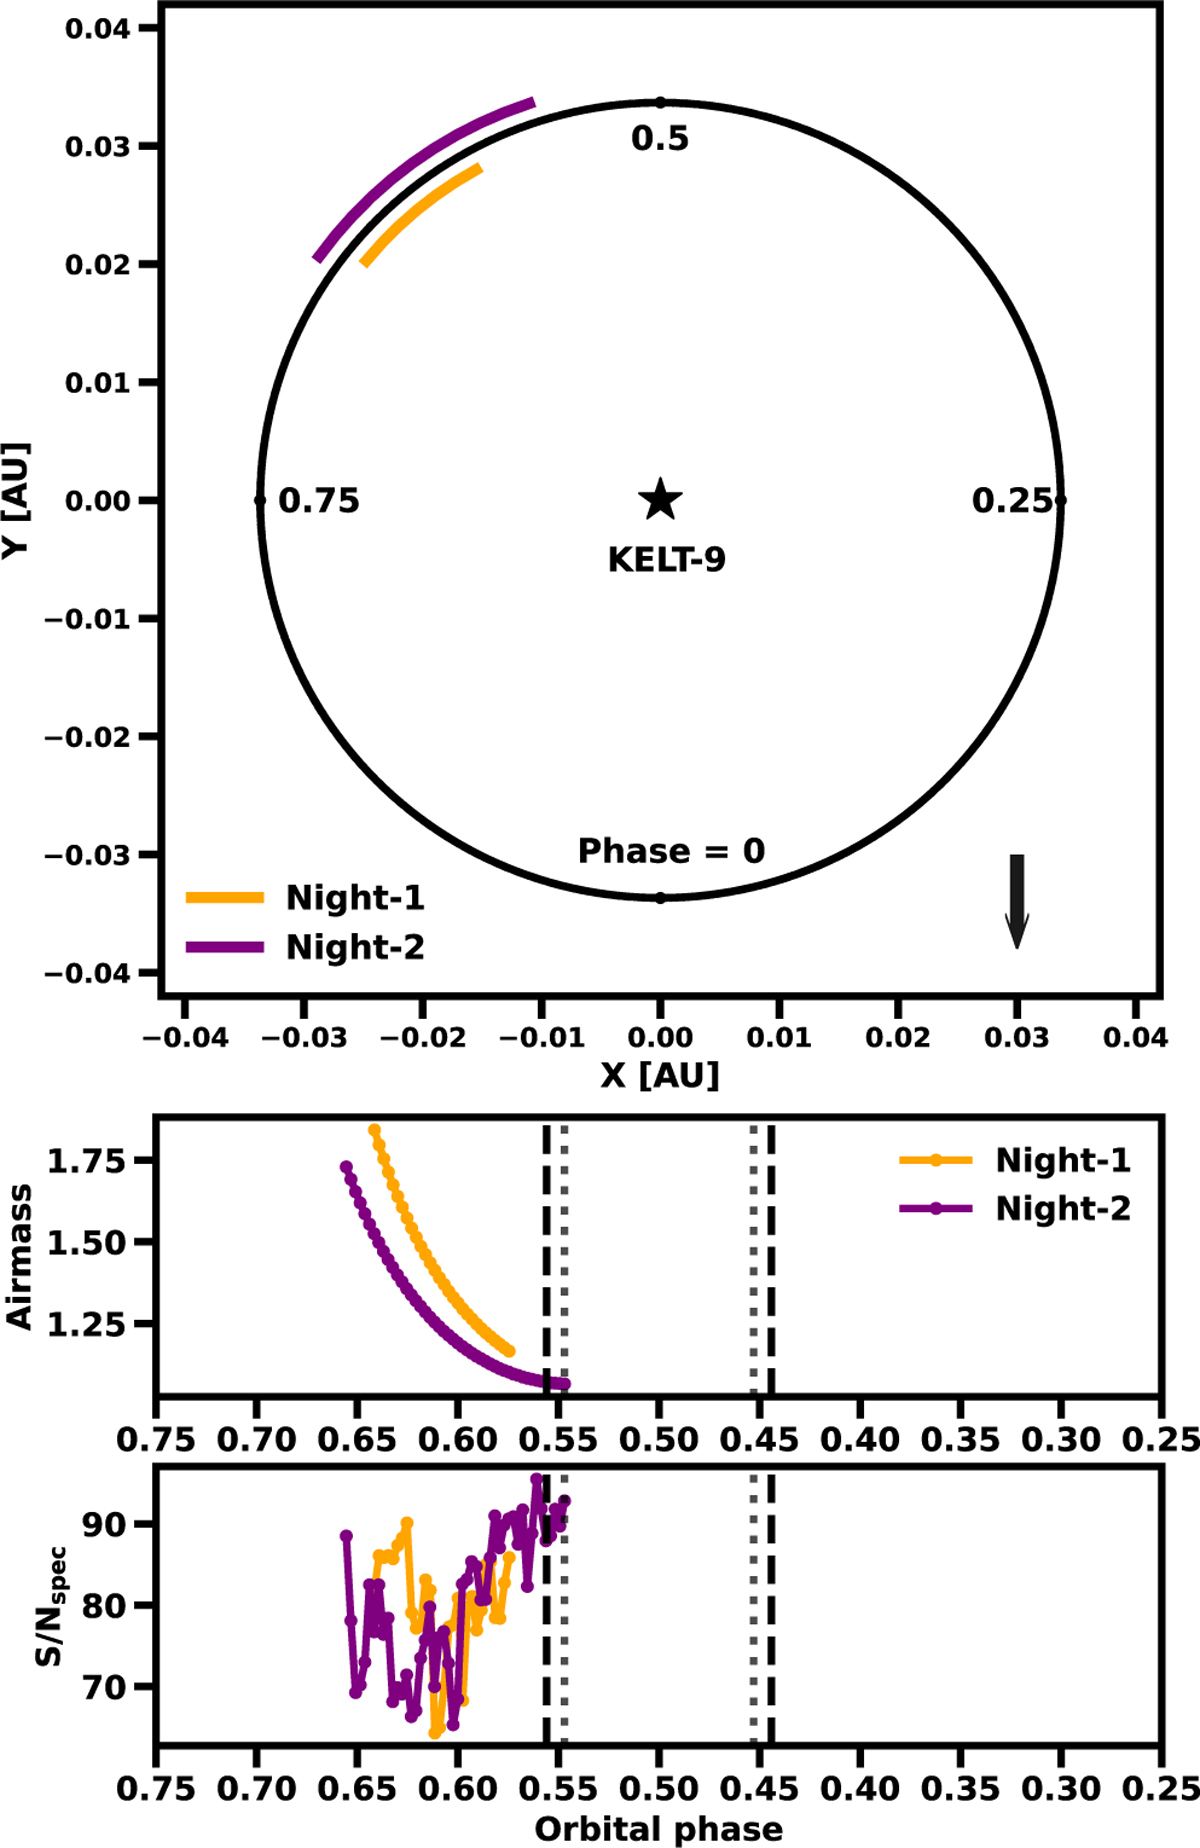
Upper panel: phase coverage of the thermal emission observations. Middle panel: airmass as a function of orbital phase for each observation. Lower panel: S/Nspec in the spectral order of the He infrared triplet (10 830 Å) as a function of orbital phase for each observation. The colours represent different observation dates. The dashed and dotted lines indicate the eclipse duration (T14) and the fully in-eclipse duration (T23), respectively.
Current usage metrics show cumulative count of Article Views (full-text article views including HTML views, PDF and ePub downloads, according to the available data) and Abstracts Views on Vision4Press platform.
Data correspond to usage on the plateform after 2015. The current usage metrics is available 48-96 hours after online publication and is updated daily on week days.
Initial download of the metrics may take a while.