Fig. 10
Download original image
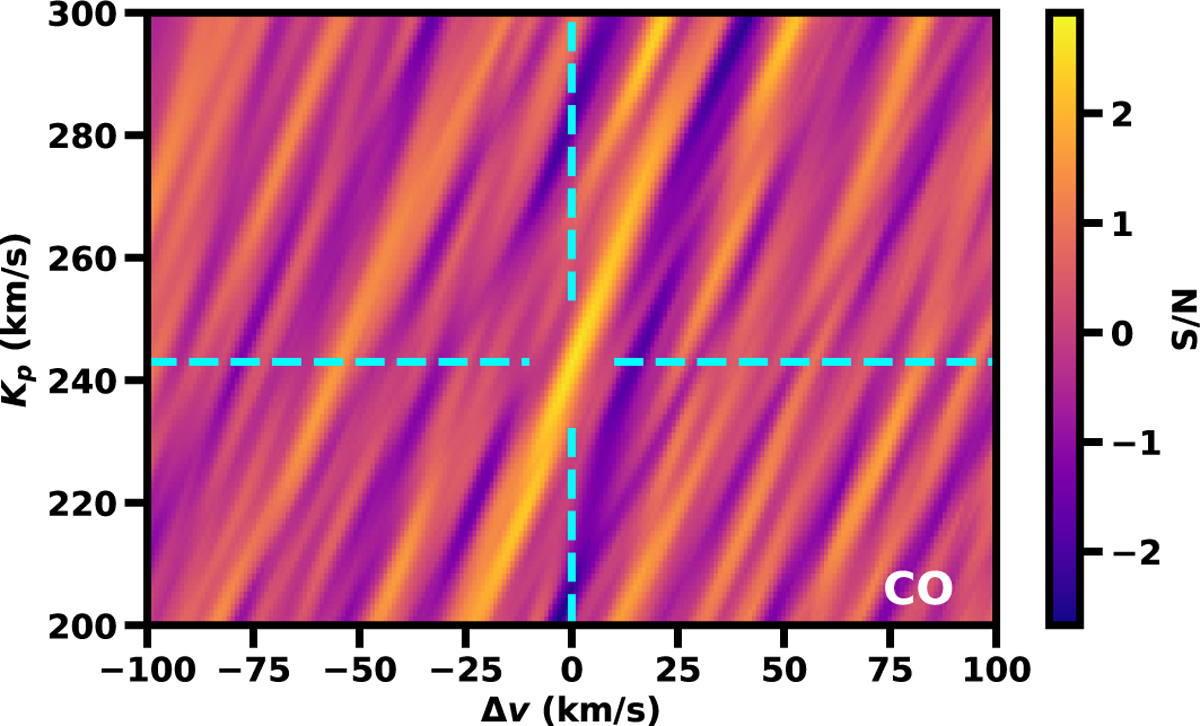
Kp map of CO based on the best-fitting model from the chemical equilibrium retrieval. The map is shown in the same format as the right panel of Fig. 3. The tentative detection demonstrates the utility of retrieval-guided cross-correlation analyses, highlighting subtle CO signals that were not detected in the initial analysis.
Current usage metrics show cumulative count of Article Views (full-text article views including HTML views, PDF and ePub downloads, according to the available data) and Abstracts Views on Vision4Press platform.
Data correspond to usage on the plateform after 2015. The current usage metrics is available 48-96 hours after online publication and is updated daily on week days.
Initial download of the metrics may take a while.