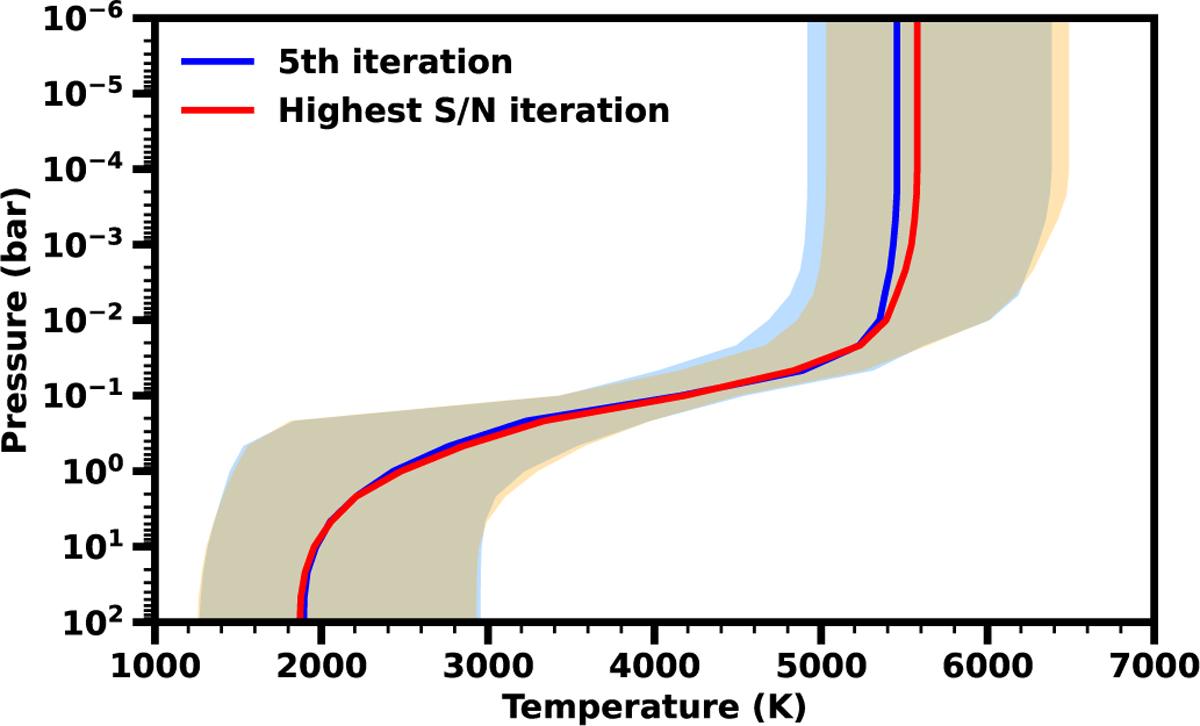
Fig. A.3
Download original image
Retrieved T-P profiles from the chemical equilibrium retrieval using different SYSREM iterations. The blue line shows the 5th iteration and the red line corresponds to the iteration with the highest S/N (i.e. the 4th and 10th iterations for Night-1 and Night-2, respectively). The shaded regions indicate the 1σ confidence intervals. The results indicate that the choice of SYSREM iteration has only a limited impact on our dataset.
Current usage metrics show cumulative count of Article Views (full-text article views including HTML views, PDF and ePub downloads, according to the available data) and Abstracts Views on Vision4Press platform.
Data correspond to usage on the plateform after 2015. The current usage metrics is available 48-96 hours after online publication and is updated daily on week days.
Initial download of the metrics may take a while.