Fig. 3
Download original image
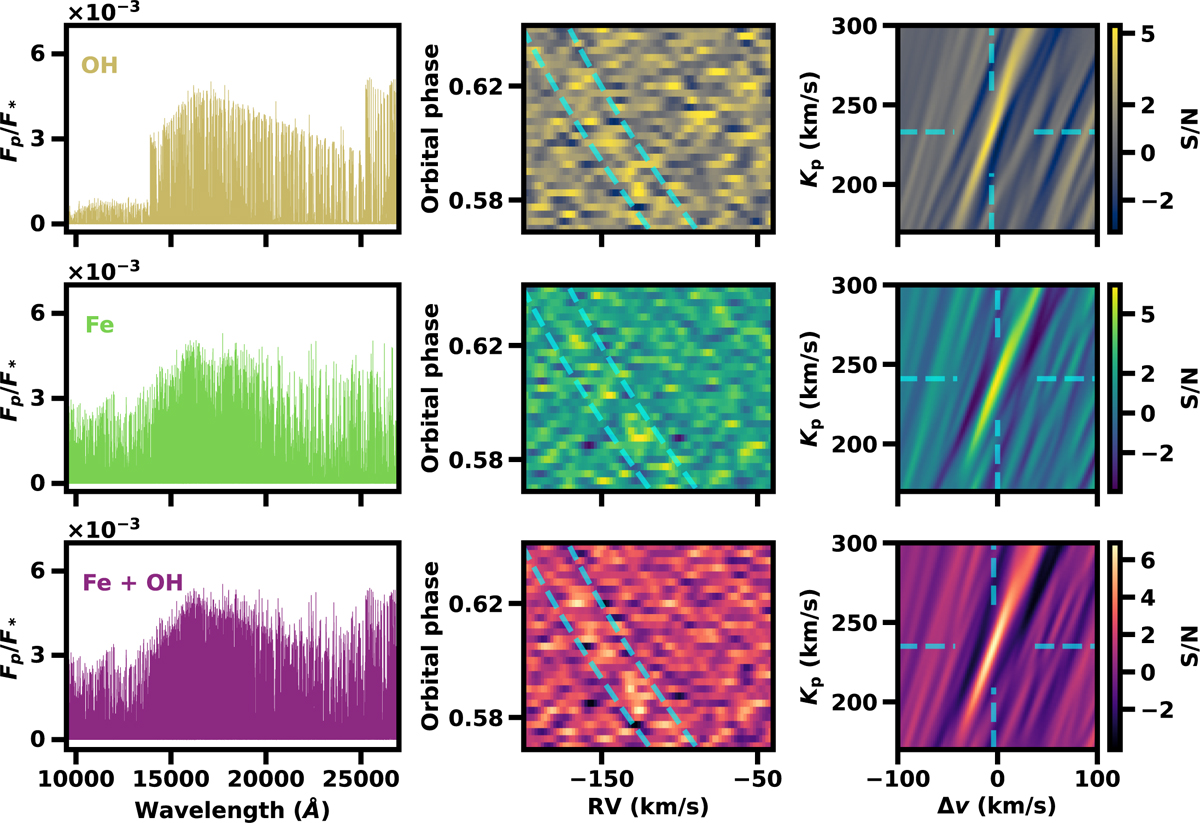
Model spectra, CCF maps, and Kp maps for OH, Fe, and both species combined. Left panel shows the model spectra after continuum removal. Middle panel displays the CCF map in the stellar rest frame (i.e. corrected for BERV and systemic velocity). The dashed cyan line represents the planetary RV derived from the expected value of Kp. Right panela presents the Kp map for each molecule. The dashed lines intersecting at the cross mark indicate the position of the S/N peak. The colour bar represents the S/N values.
Current usage metrics show cumulative count of Article Views (full-text article views including HTML views, PDF and ePub downloads, according to the available data) and Abstracts Views on Vision4Press platform.
Data correspond to usage on the plateform after 2015. The current usage metrics is available 48-96 hours after online publication and is updated daily on week days.
Initial download of the metrics may take a while.