Fig. 7
Download original image
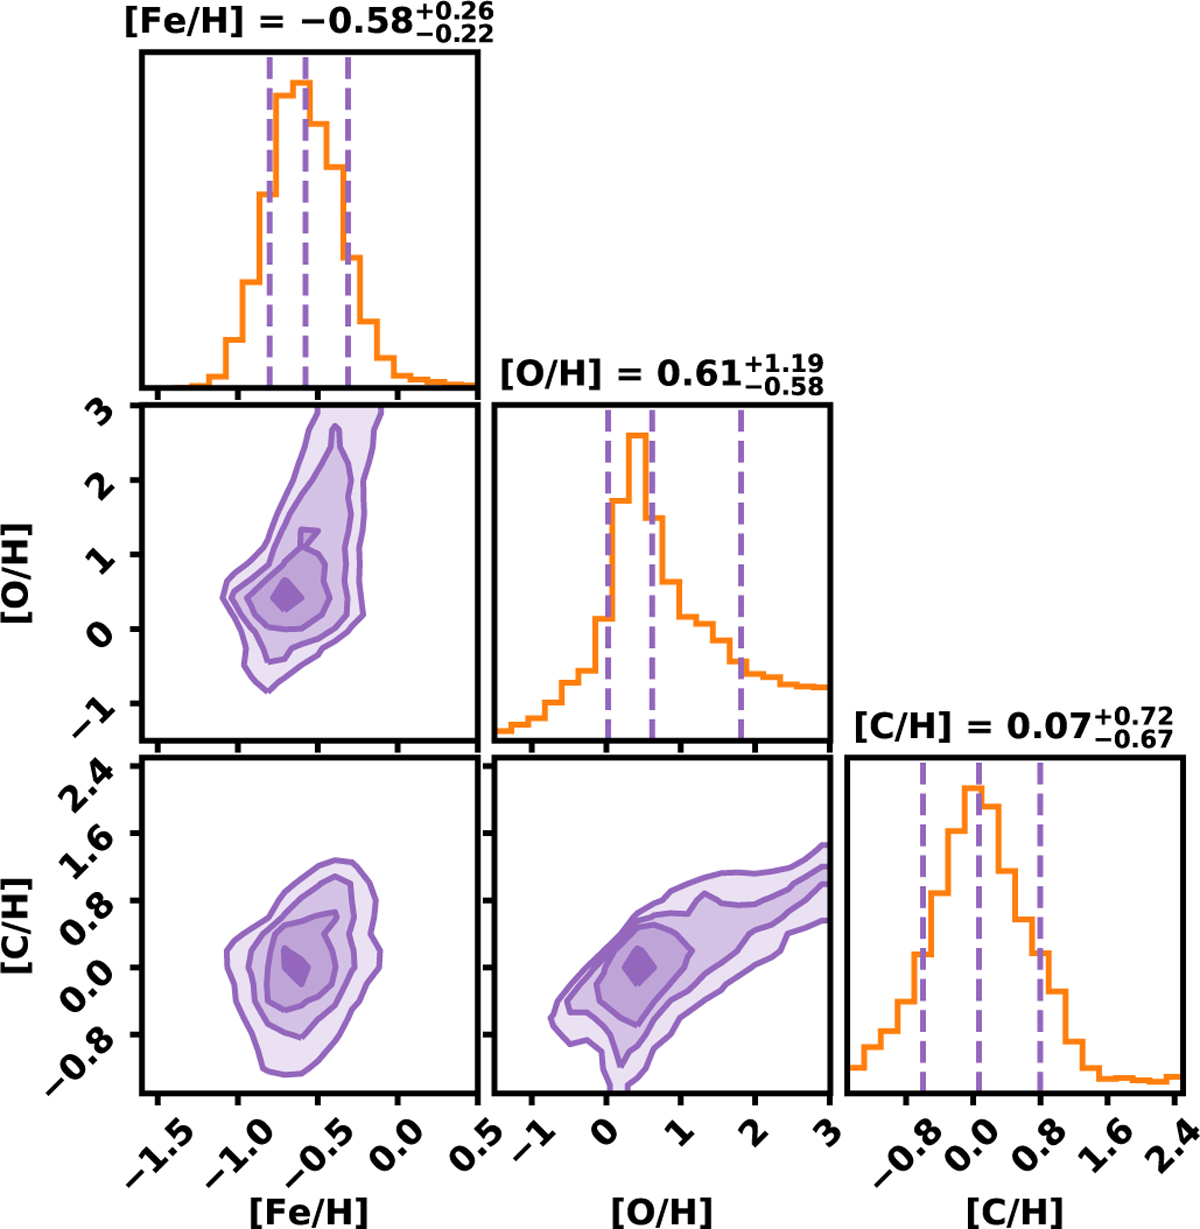
Retrieved logarithmic elemental abundances in KELT-9b’s dayside atmosphere under chemical equilibrium. The corner plots show the posterior distributions and correlations between the atmospheric parameters. The dashed vertical lines in the posterior distributions denote the median and ±1σ credible intervals. All abundances are given relative to Sun.
Current usage metrics show cumulative count of Article Views (full-text article views including HTML views, PDF and ePub downloads, according to the available data) and Abstracts Views on Vision4Press platform.
Data correspond to usage on the plateform after 2015. The current usage metrics is available 48-96 hours after online publication and is updated daily on week days.
Initial download of the metrics may take a while.