Fig. 8
Download original image
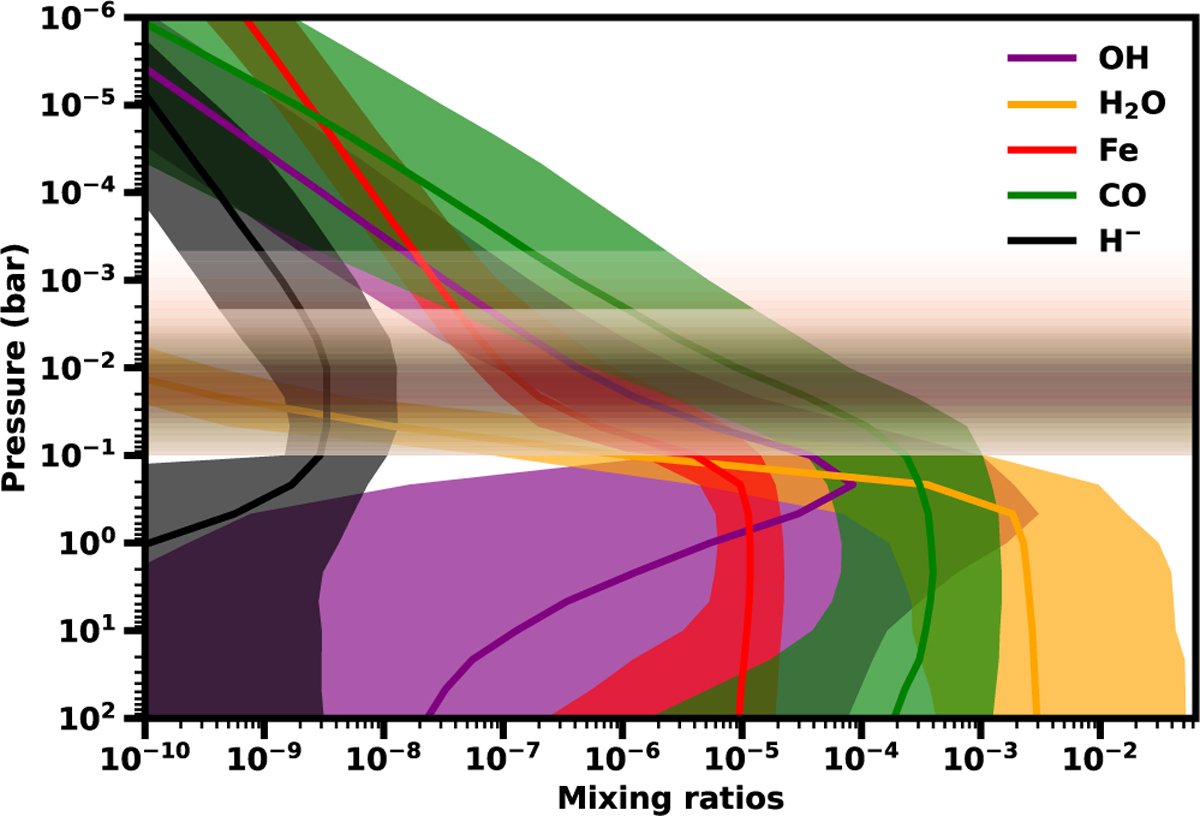
Derived vertical volume mixing ratio profiles for various species. These profiles are calculated using the retrieved T-P profile together with the retrieved elemental abundance and metallicity. The solid line represents the median vertical volume mixing ratio profile, while the shadow shows the 1σ envelope. The horizontal shadows indicate the contribution functions of thermal emission from different species.
Current usage metrics show cumulative count of Article Views (full-text article views including HTML views, PDF and ePub downloads, according to the available data) and Abstracts Views on Vision4Press platform.
Data correspond to usage on the plateform after 2015. The current usage metrics is available 48-96 hours after online publication and is updated daily on week days.
Initial download of the metrics may take a while.