Open Access
Fig. 3.
Download original image
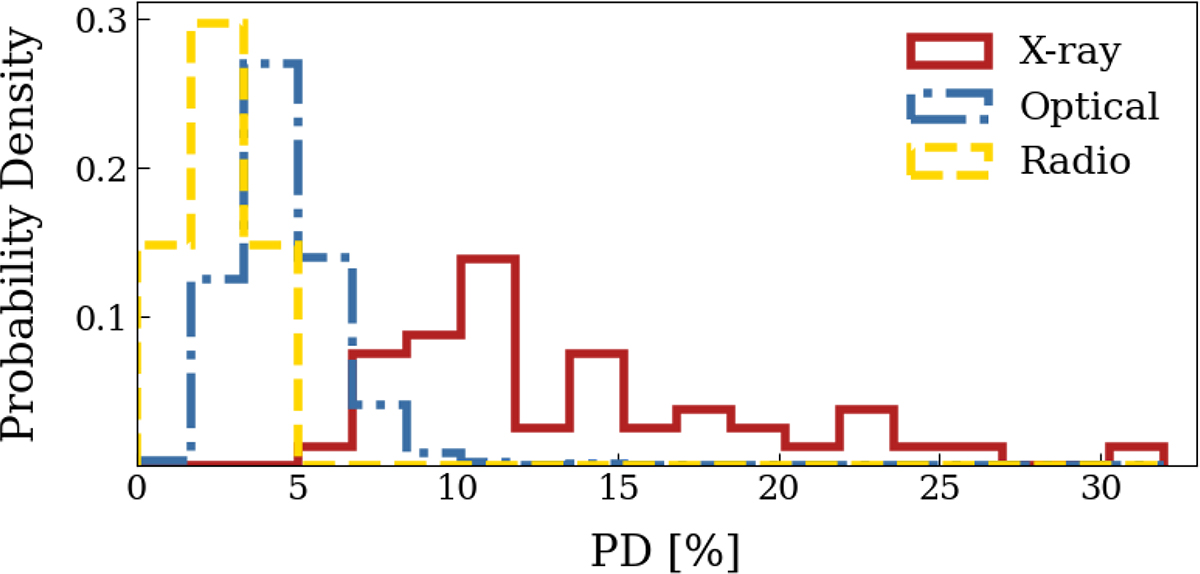
Measured PD of all HSP observations in each spectral range: X-ray (red solid line), optical (blue dash-dotted line), and mm-radio (yellow dashed line). The histogram is normalised due to the low number of radio observations with respect to the other bands.
Current usage metrics show cumulative count of Article Views (full-text article views including HTML views, PDF and ePub downloads, according to the available data) and Abstracts Views on Vision4Press platform.
Data correspond to usage on the plateform after 2015. The current usage metrics is available 48-96 hours after online publication and is updated daily on week days.
Initial download of the metrics may take a while.