Fig. 5.
Download original image
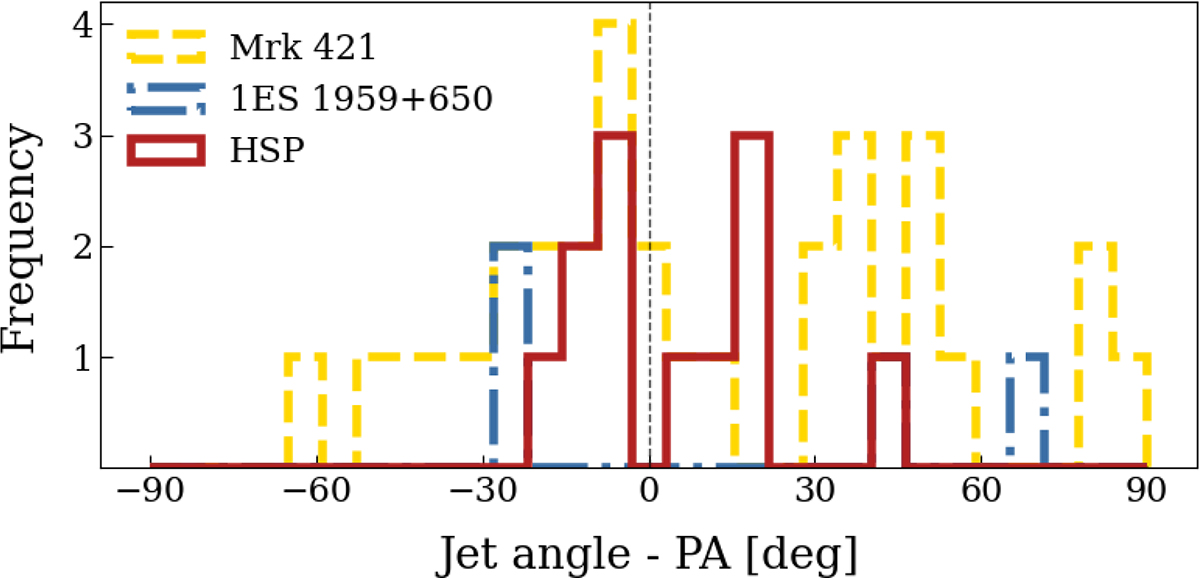
Histogram of the angular difference between the jet and the X-ray PA, computed for every HSP observation. Mrk 421 (yellow dashed line) and 1ES 1959+650 (blue dash-dotted line) are plotted separately from the others, as they present large amplitude rotations of the PA during the IXPE observation periods. The other sources are plotted altogether (red solid line).
Current usage metrics show cumulative count of Article Views (full-text article views including HTML views, PDF and ePub downloads, according to the available data) and Abstracts Views on Vision4Press platform.
Data correspond to usage on the plateform after 2015. The current usage metrics is available 48-96 hours after online publication and is updated daily on week days.
Initial download of the metrics may take a while.