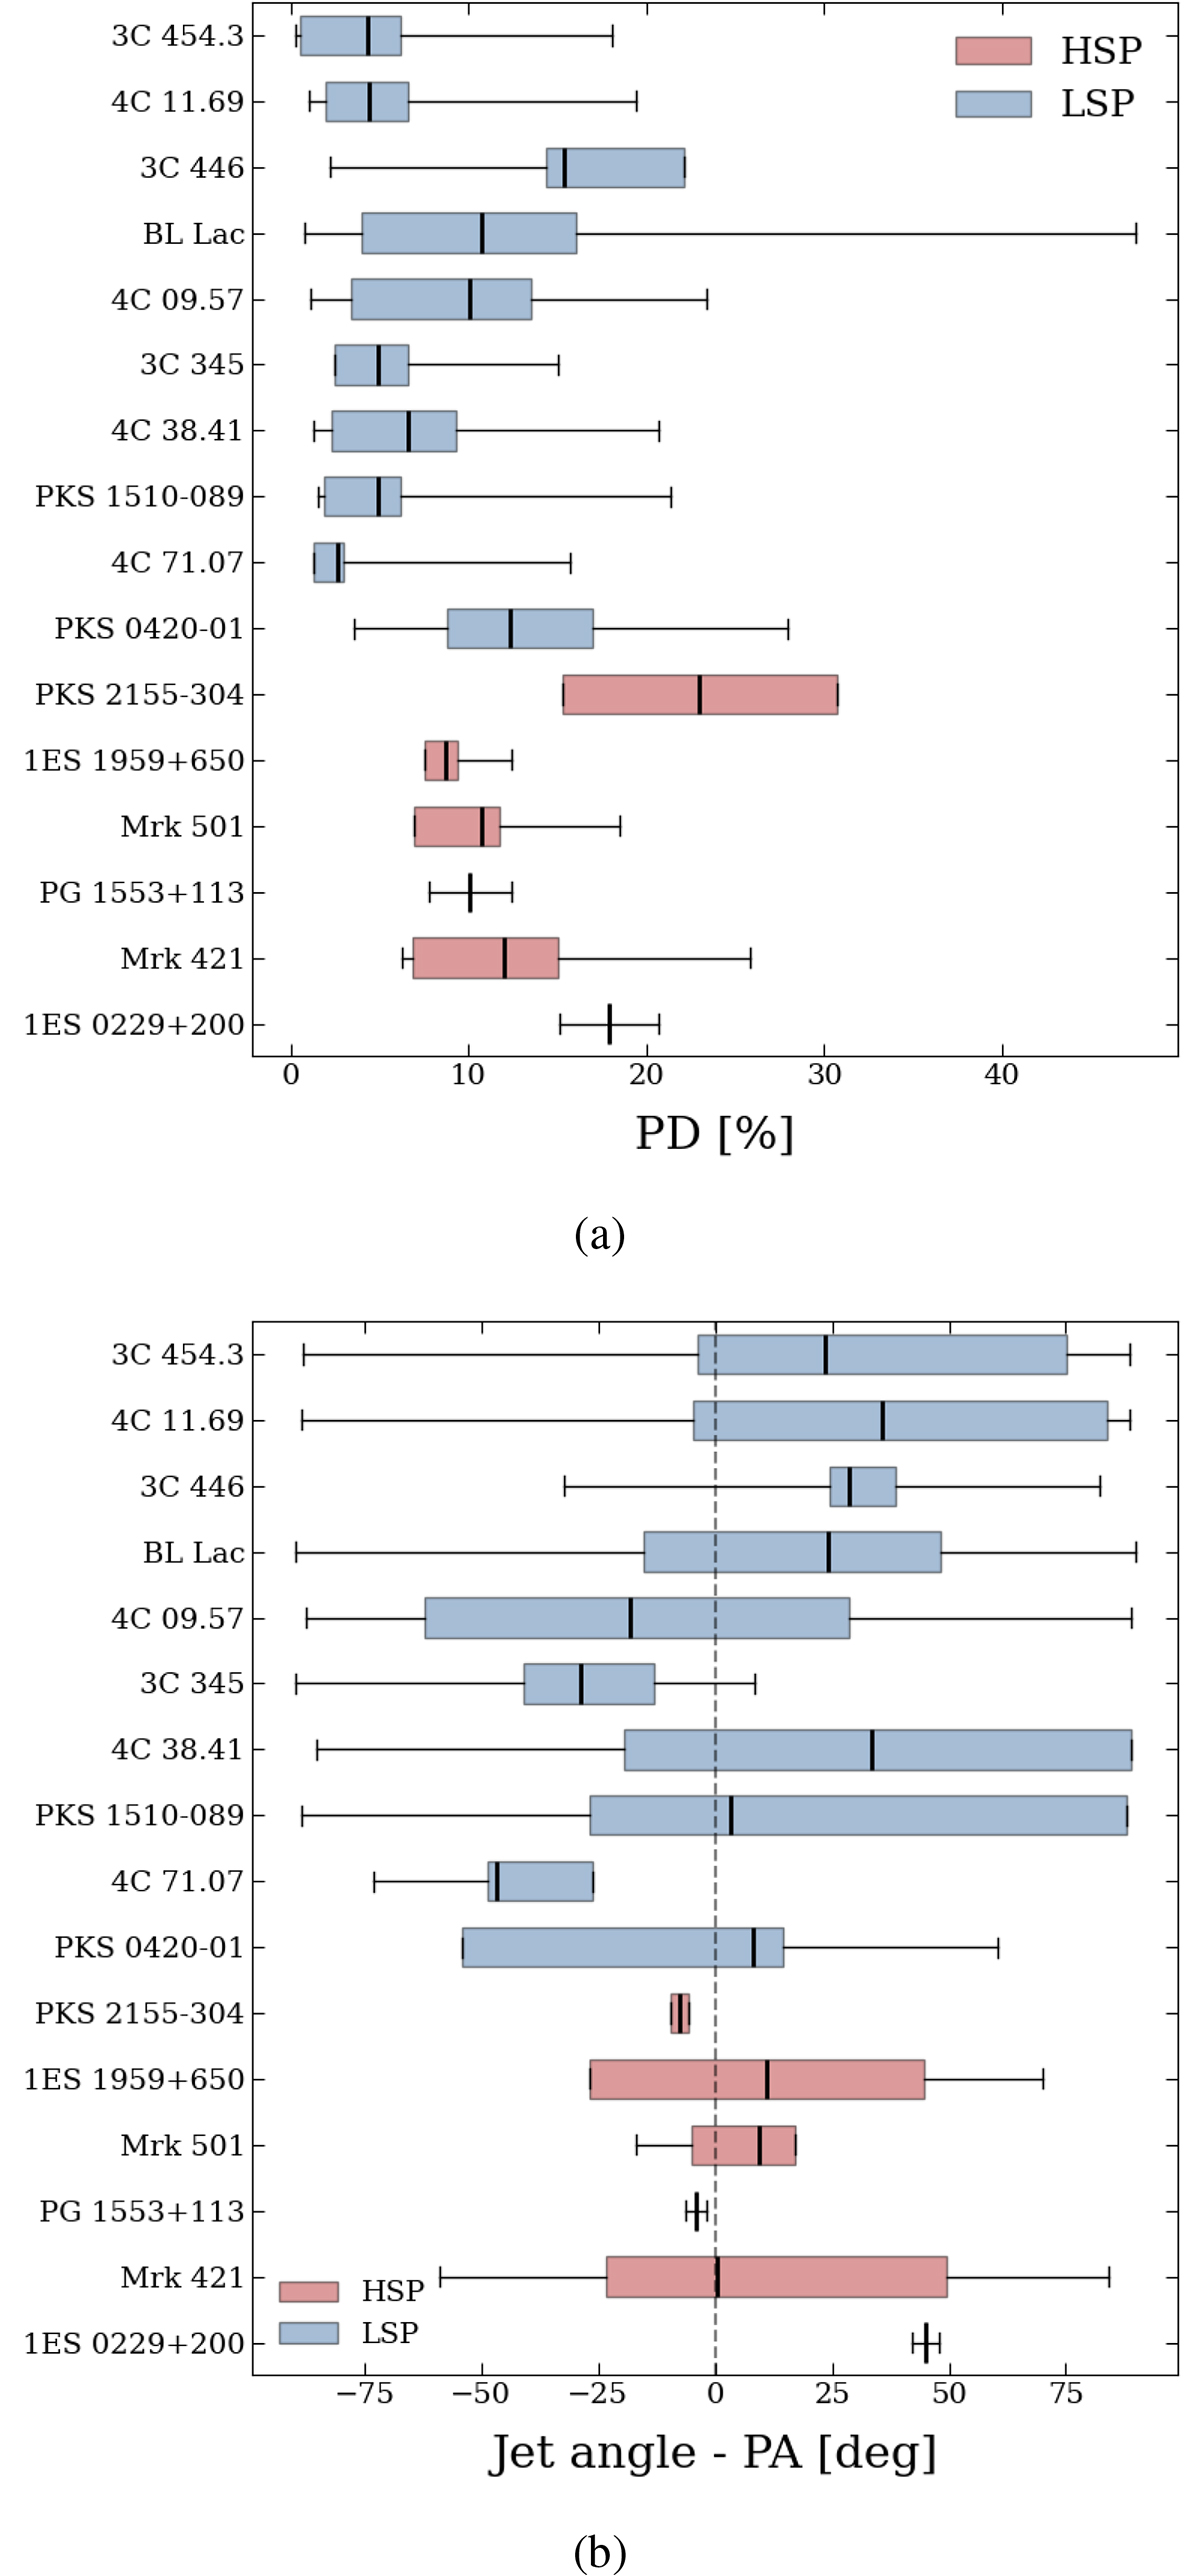
Fig. 6.
Download original image
PD of the sources in our sample represented in the first box plot (LSP in blue, above; HSP in red, below). The angular difference between the jet direction and the PA of the sources is represented in the second box plot, with the dashed black line indicating a difference of 0° (LSP in blue, above; HSP in red, below). The black vertical line inside the coloured box marks the median over all observations. The coloured box represents the shortest interval containing 68% of the observations, while the horizontal black lines extend to the full range of values measured across all observations considered. Note: for PKS 2155−304 the coloured box covers the full range, as we only had two observations; for PG 1553+113 and 1ES 0229+200, we only had one observation, so we represent the measurement and its error.
Current usage metrics show cumulative count of Article Views (full-text article views including HTML views, PDF and ePub downloads, according to the available data) and Abstracts Views on Vision4Press platform.
Data correspond to usage on the plateform after 2015. The current usage metrics is available 48-96 hours after online publication and is updated daily on week days.
Initial download of the metrics may take a while.