Fig. 10
Download original image
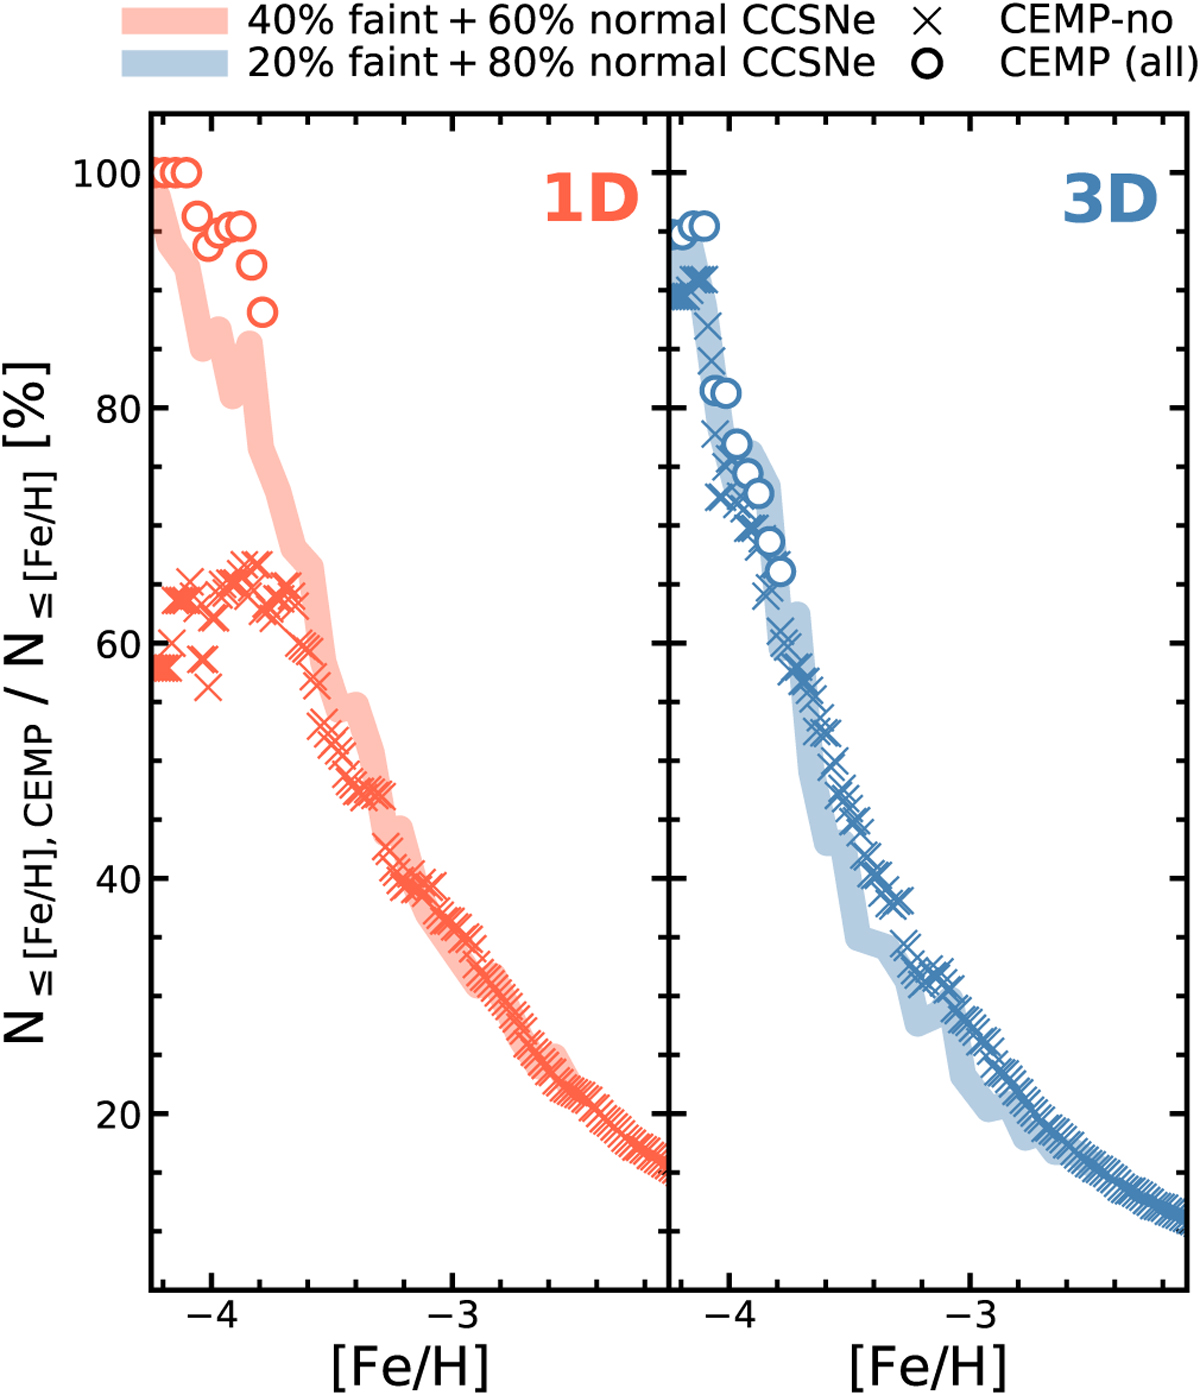
Cumulative CEMP-no fraction predictions from Hartwig et al. (2018) compared to our data. Below [Fe/H] < −3.75, all CEMP stars in our sample are shown (circles). 3D CEMP data are shown in blue (right panel) and 1D data in red (left panel). The red line in the left panel corresponds to the fiducial model of Hartwig et al. (2018), which comprises 40% faint (from Ishigaki et al. 2014) and 60% normal CCSNe (from Nomoto et al. 2013). The blue curve in the right panel corresponds to their 20% faint, 80% normal CCSN model.
Current usage metrics show cumulative count of Article Views (full-text article views including HTML views, PDF and ePub downloads, according to the available data) and Abstracts Views on Vision4Press platform.
Data correspond to usage on the plateform after 2015. The current usage metrics is available 48-96 hours after online publication and is updated daily on week days.
Initial download of the metrics may take a while.