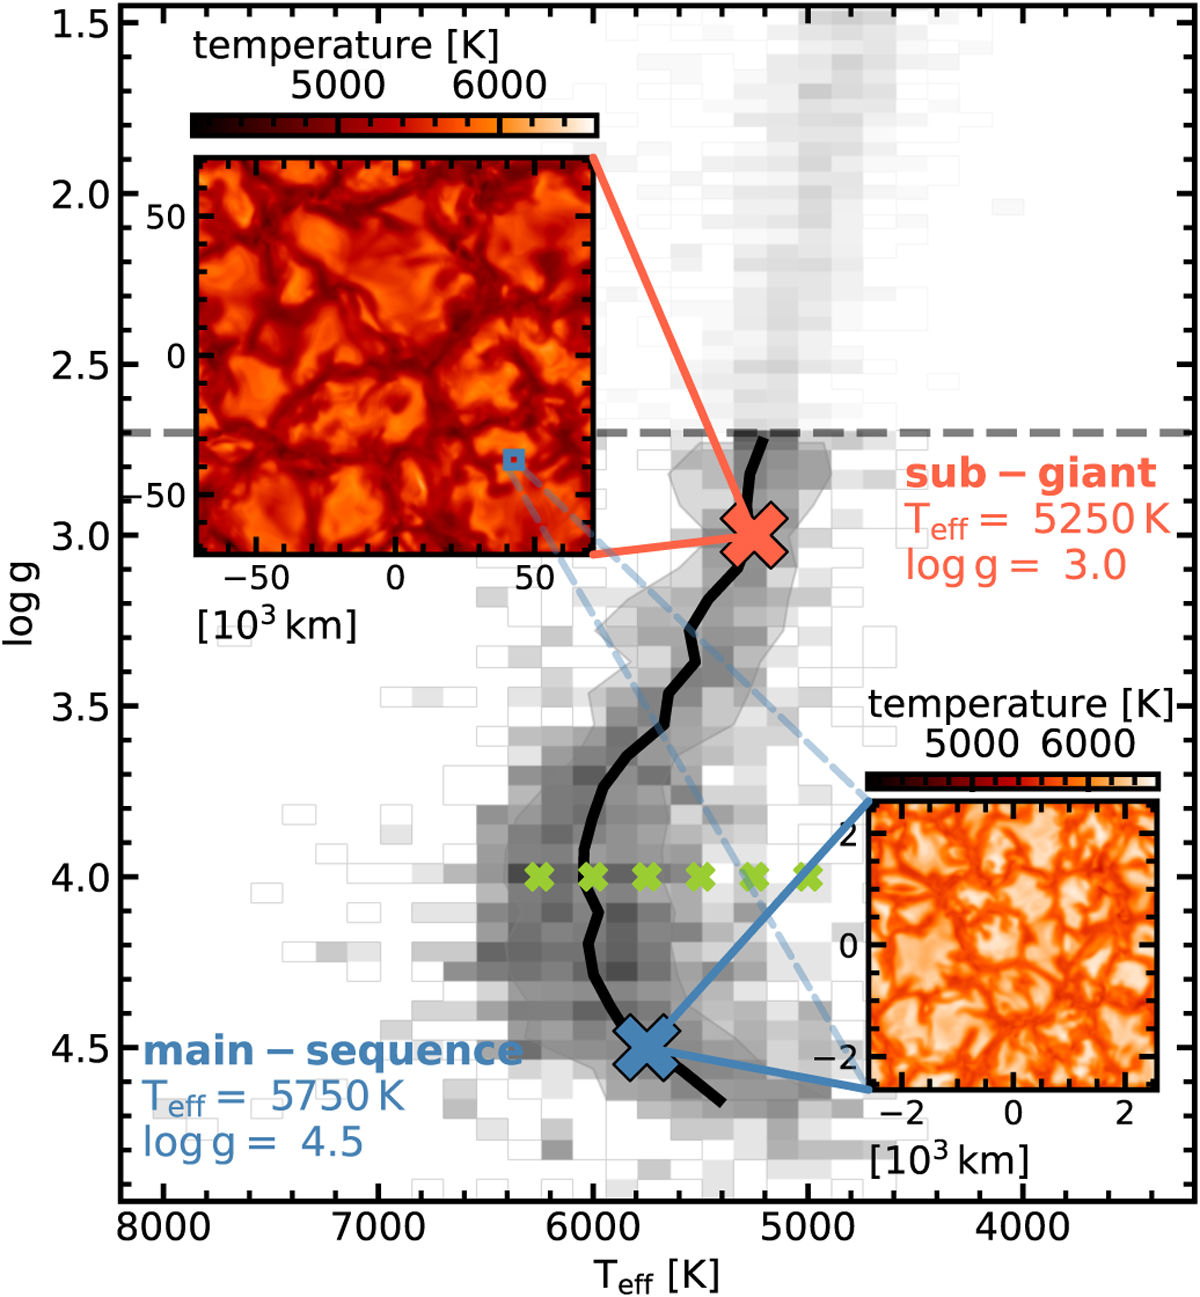
Fig. A.1
Download original image
2D histogram of the dataset used in this paper in the Teff vs log g plane. The log g-limit of 2.7 applied in this work is shown as a dashed black line. The solid black line represents the mean in bins of constant log g. Red and blue crosses mark the location of the 3D M3DIS models. The insets show the temperature distribution at the optical surface of the respective model with [Fe/H] = −5. To highlight the different physical scales involved, the blue square in the inset shows the size of the MS model. To estimate the dependence of 3D A(C) corrections on effective temperature, additional models are created at the locations highlighted with green crosses.
Current usage metrics show cumulative count of Article Views (full-text article views including HTML views, PDF and ePub downloads, according to the available data) and Abstracts Views on Vision4Press platform.
Data correspond to usage on the plateform after 2015. The current usage metrics is available 48-96 hours after online publication and is updated daily on week days.
Initial download of the metrics may take a while.