Fig. 3
Download original image
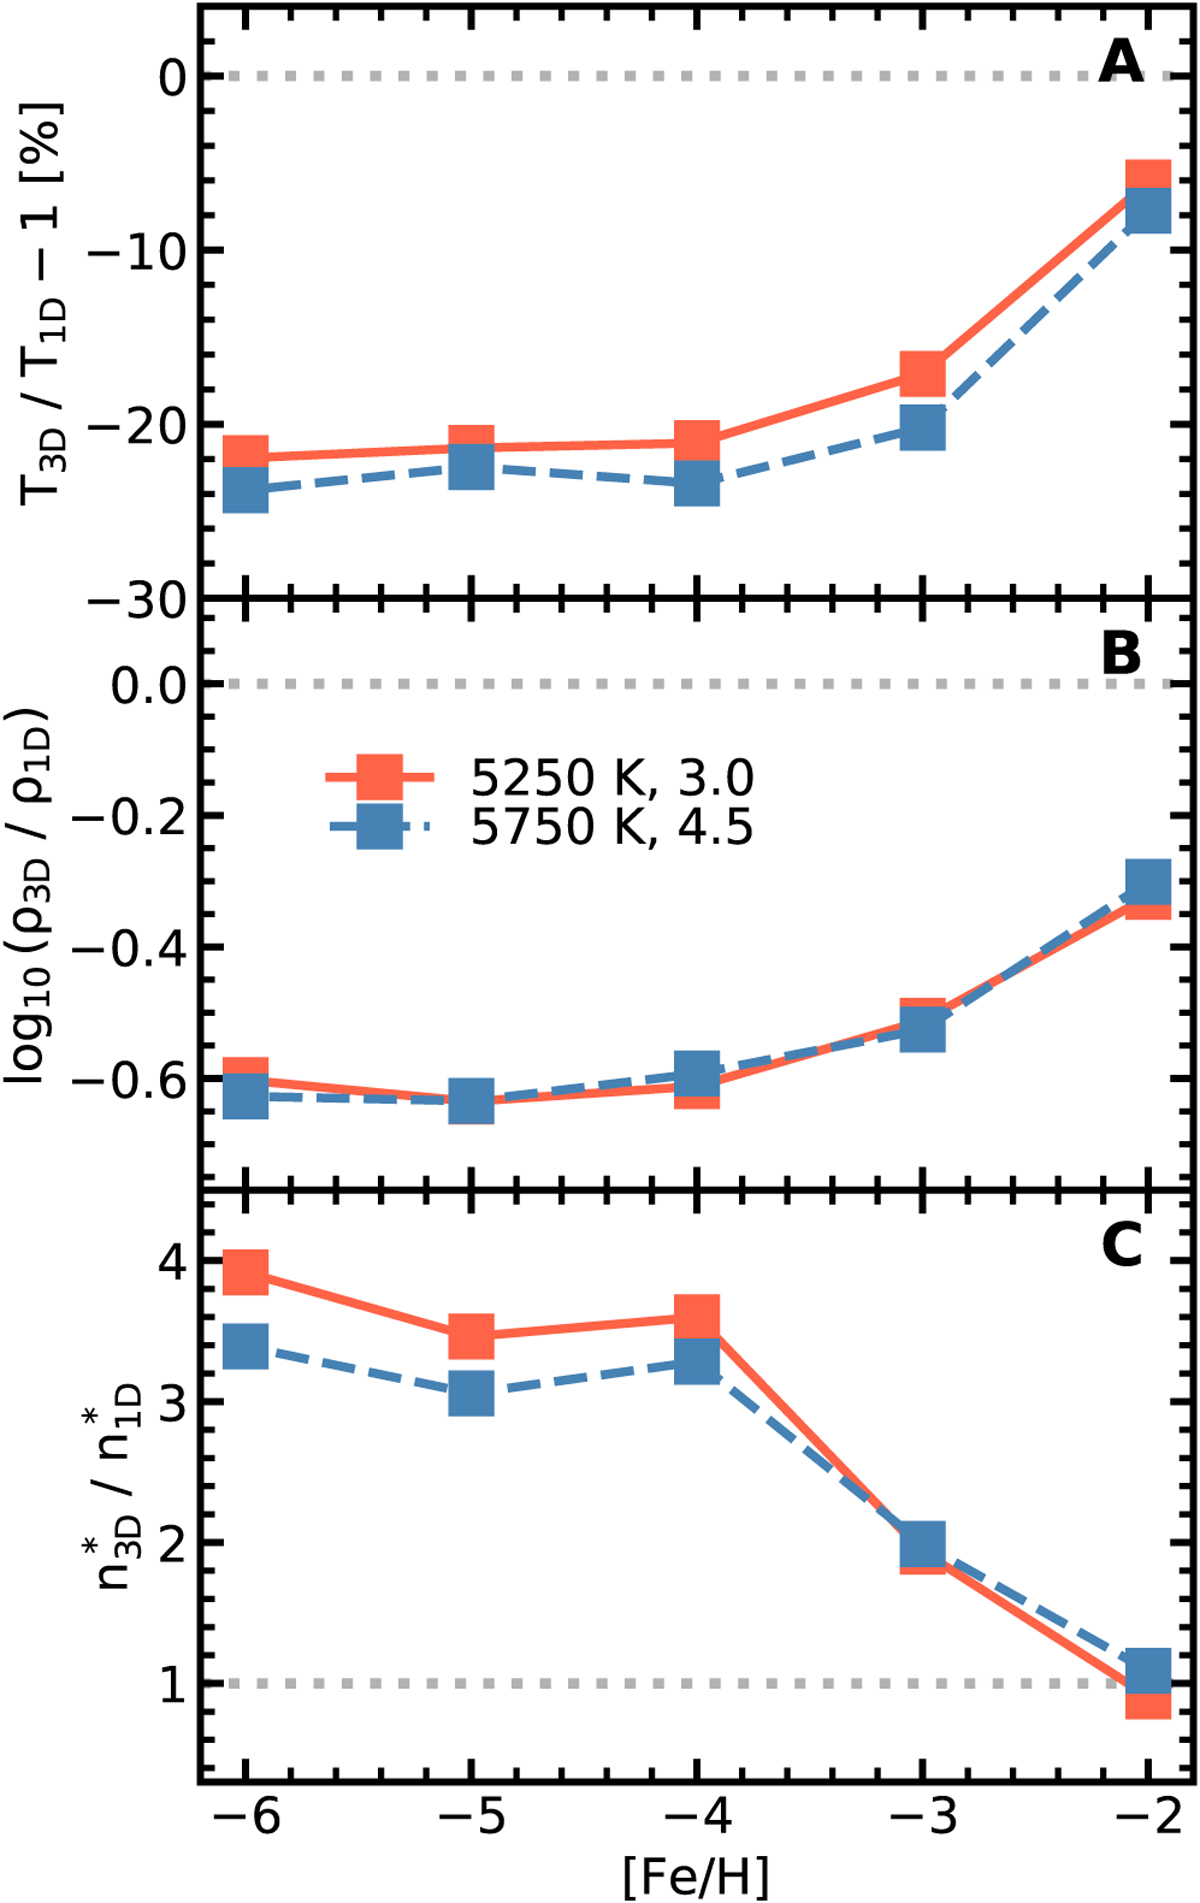
Difference between 3D CEMP and 1D MARCS models as a function of metallicity. Top: Relative temperature difference (in percent). Middle: Logarithmic density differences (in dex). Bottom: CH/H number density fraction, where n* = nCH/nH is the CH number density relative to the hydrogen number density. Dashed blue lines correspond to Teff = 5750 K, log(g) = 4.5 models, solid red curves to Teff = 5250 K, log(g) = 3.0. The differences in each figure are computed at the representative formation height of the strong lines in the G band. See Sect. 3.2 for more information.
Current usage metrics show cumulative count of Article Views (full-text article views including HTML views, PDF and ePub downloads, according to the available data) and Abstracts Views on Vision4Press platform.
Data correspond to usage on the plateform after 2015. The current usage metrics is available 48-96 hours after online publication and is updated daily on week days.
Initial download of the metrics may take a while.