Fig. 7
Download original image
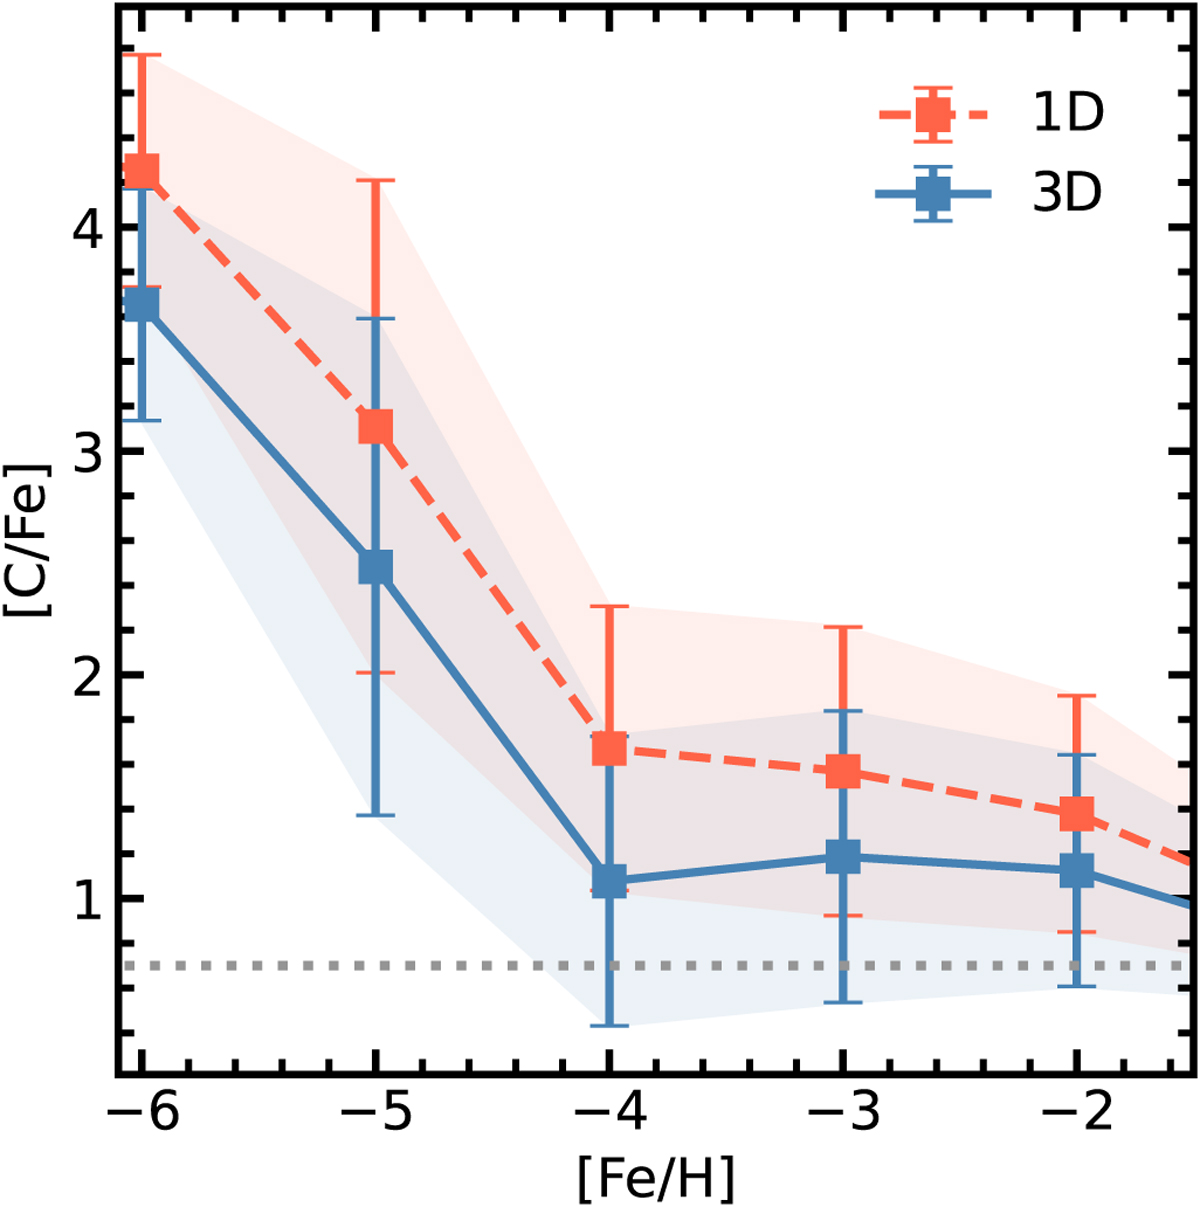
[C/Fe] against [Fe/H] for 3D CEMP and 1D measurements of Galactic stars from a MS + sub-giant subsample of the SAGA database. The dashed red line represents the mean, uncorrected 1D and the solid blue line the 3D CEMP-corrected data. Shaded regions correspond to standard deviations of the observed sample in the respective metallicity bin ±0.5 dex. The dotted grey line represents the dividing CEMP classification abundance of [C/Fe] = 0.7.
Current usage metrics show cumulative count of Article Views (full-text article views including HTML views, PDF and ePub downloads, according to the available data) and Abstracts Views on Vision4Press platform.
Data correspond to usage on the plateform after 2015. The current usage metrics is available 48-96 hours after online publication and is updated daily on week days.
Initial download of the metrics may take a while.