Fig. 8
Download original image
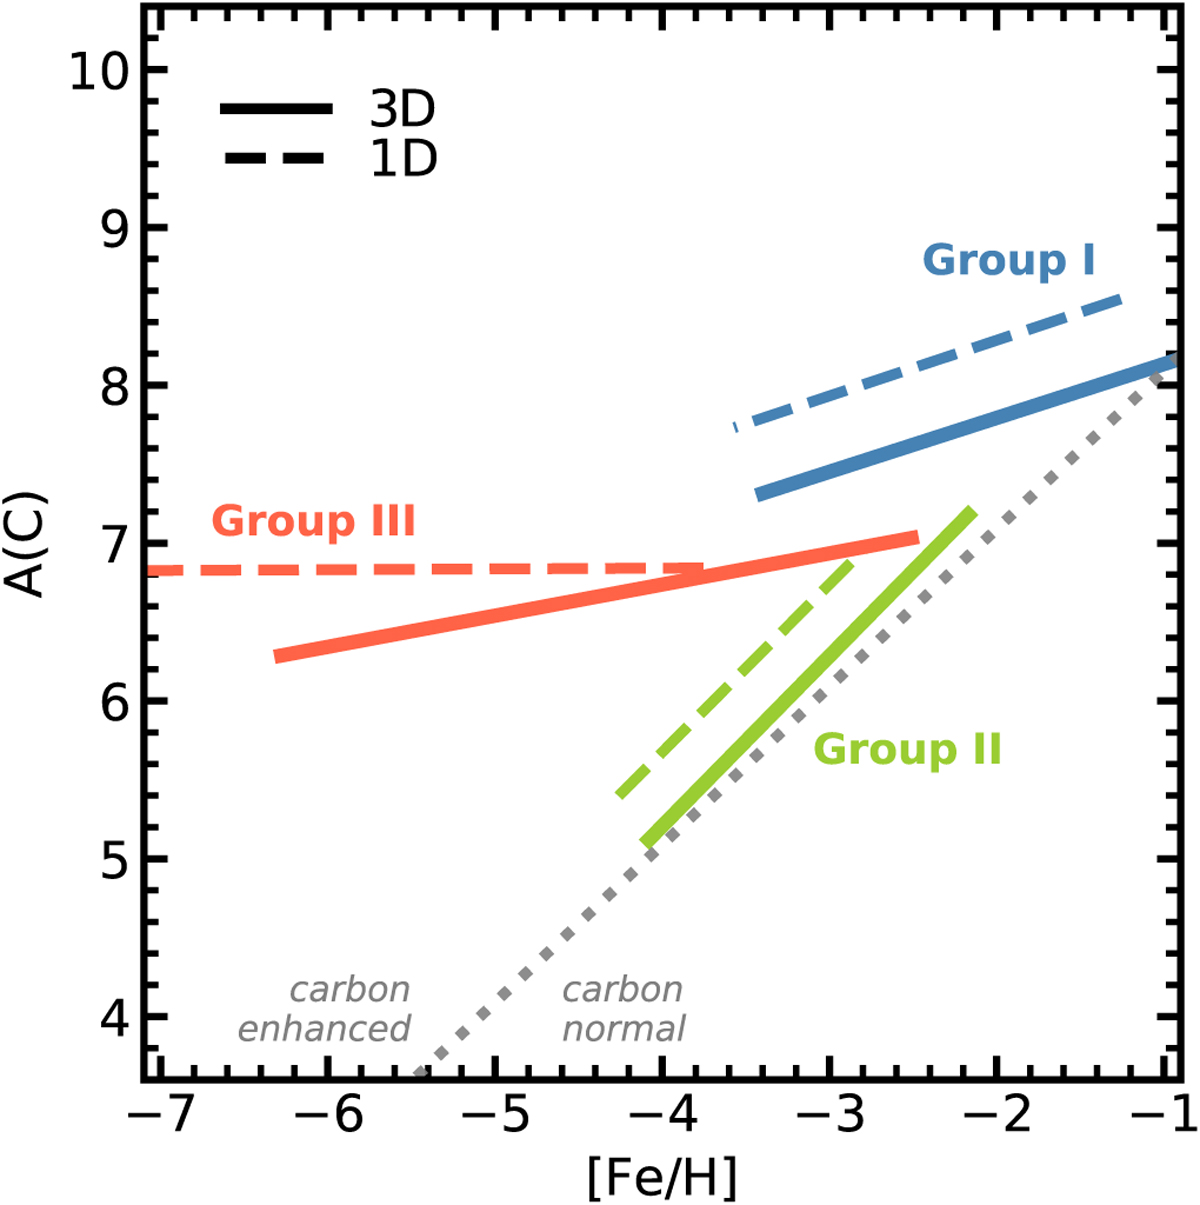
Yoon-Beers (Yoon et al. 2016) diagram of A(C) against [Fe/H] for the 3D-corrected measurements for Galactic stars from the literature. The dotted grey line represents the dividing CEMP classification abundance of [C/Fe] = 0.7. Coloured lines show the major axis of the ellipse representing the distribution of different CEMP groups. In 1D (dashed lines), ellipses are drawn similar to Yoon et al. (2016), their Fig. 1. In 3D (solid lines) ellipses are obtained from fitting a Gaussian mixture model to the data.
Current usage metrics show cumulative count of Article Views (full-text article views including HTML views, PDF and ePub downloads, according to the available data) and Abstracts Views on Vision4Press platform.
Data correspond to usage on the plateform after 2015. The current usage metrics is available 48-96 hours after online publication and is updated daily on week days.
Initial download of the metrics may take a while.