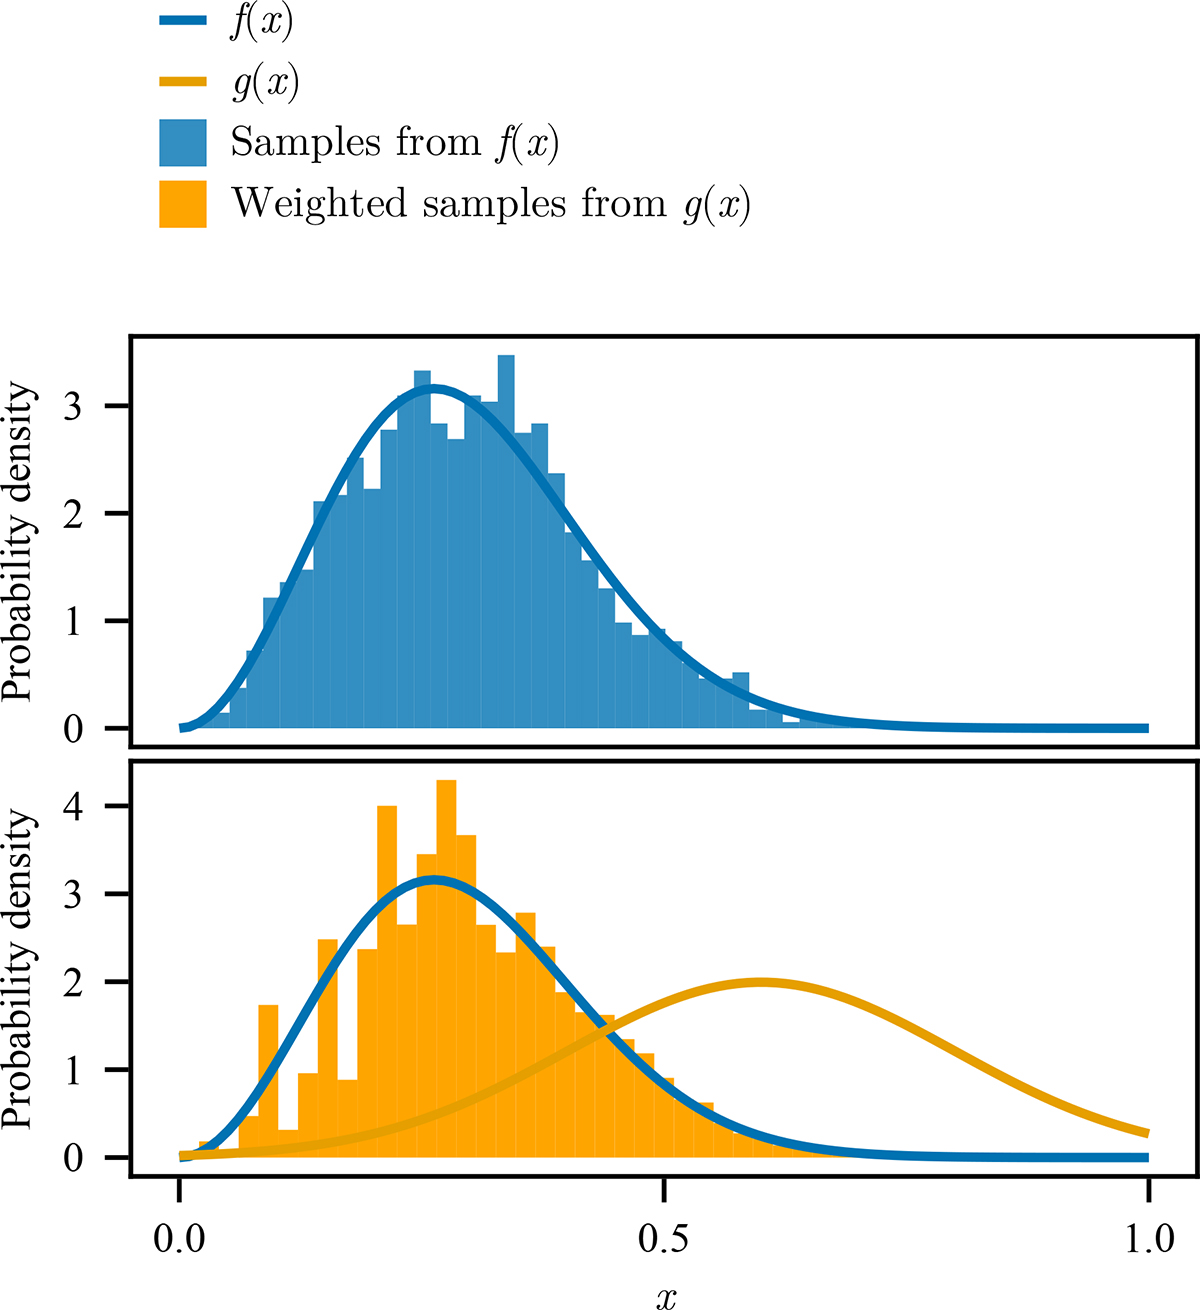
Fig. B.1.
Download original image
Showcase of importance sampling. The upper panel shows a histogram of 2000 samples directly sampled from a Maxwell-Boltzmann probability density distribution, f(x). In the lower panel, the same amount of samples are sampled from a Gaussian probability density distribution, g(x), which is shifted towards higher x values compared to the Maxwell-Boltzmann distribution. This shift increases the fraction of samples with high x-values compared to the direct sampling, and if the samples are weighted with the ratio f(x)/g(x) when binned, the resulting histogram will estimate the Maxwellian-probability distribution, but this time with higher statistical accuracy for the higher values of x.
Current usage metrics show cumulative count of Article Views (full-text article views including HTML views, PDF and ePub downloads, according to the available data) and Abstracts Views on Vision4Press platform.
Data correspond to usage on the plateform after 2015. The current usage metrics is available 48-96 hours after online publication and is updated daily on week days.
Initial download of the metrics may take a while.