Fig. 4.
Download original image
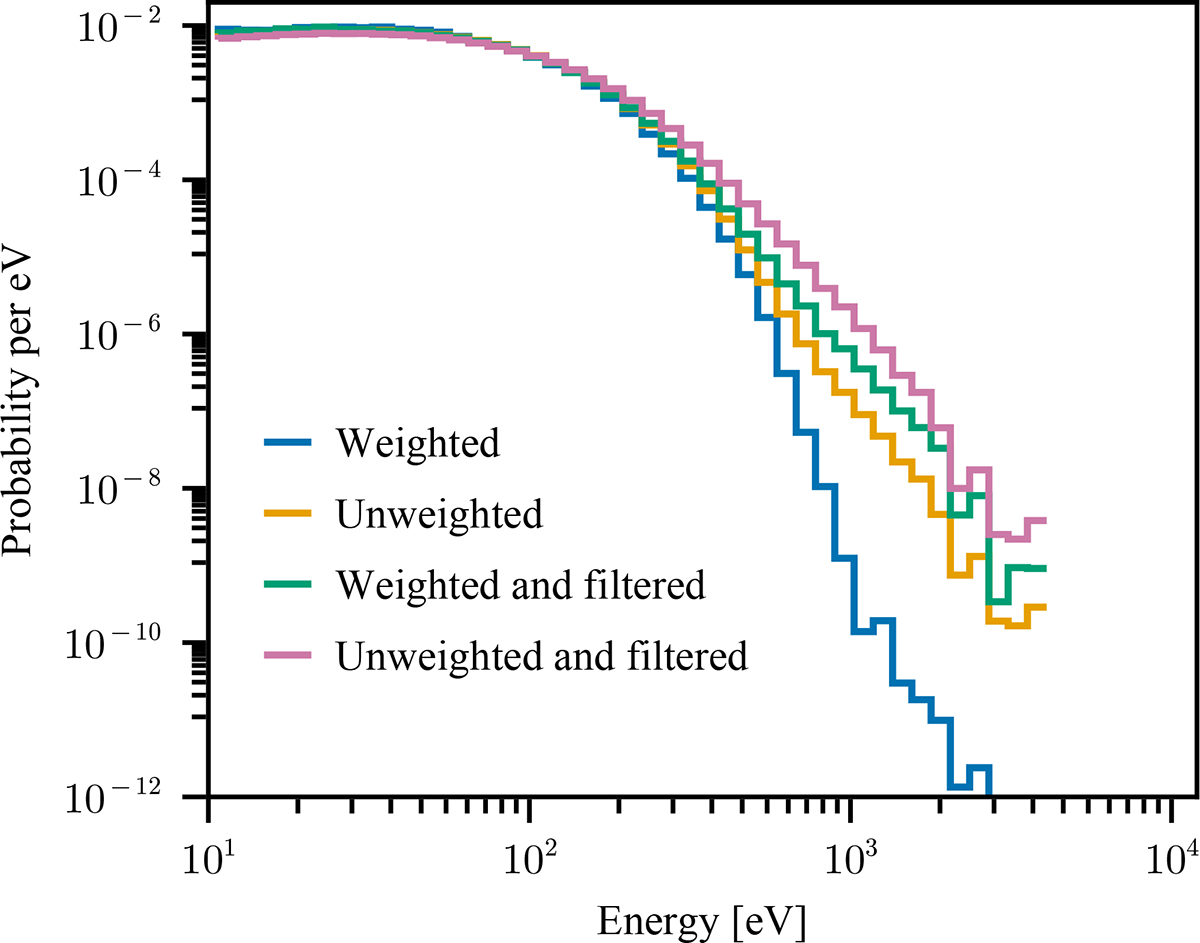
Normalised energy distribution after the third re-sampling of 13 million electrons. In this ensemble, the initial positions were sampled using Fig. 3 as a proposal distribution. The figure shows the final energy distribution with and without statistical weighting to account for the bias introduced by sampling from the proposal distribution, instead of the electron density. It also shows the distributions after applying a filter that excludes electrons outside the acceleration region, defined as the region displayed by the upper panel in Fig. 5. The distribution for energies lower than 10 eV is not shown.
Current usage metrics show cumulative count of Article Views (full-text article views including HTML views, PDF and ePub downloads, according to the available data) and Abstracts Views on Vision4Press platform.
Data correspond to usage on the plateform after 2015. The current usage metrics is available 48-96 hours after online publication and is updated daily on week days.
Initial download of the metrics may take a while.