Fig. 9.
Download original image
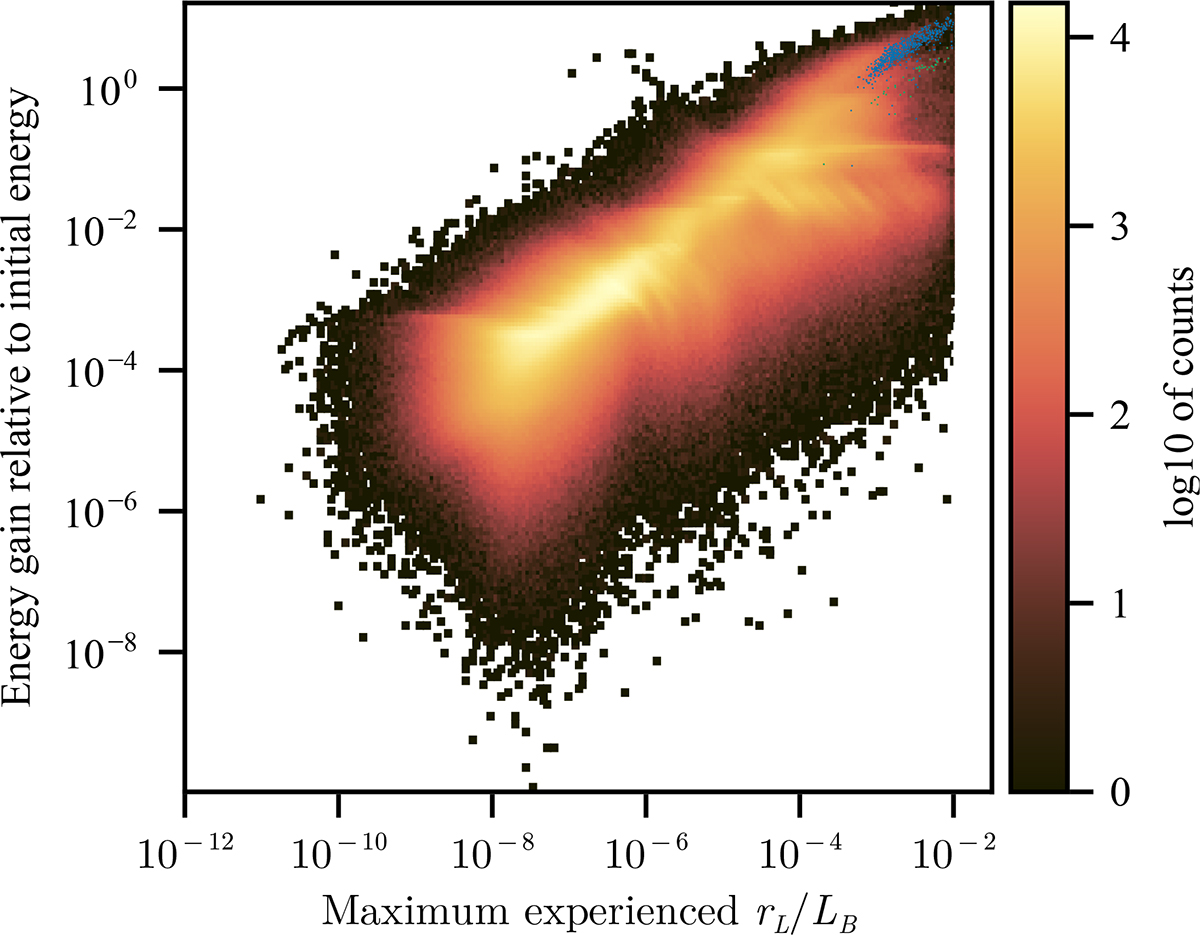
Correlation of an electron’s relative energy gain with its highest experienced value of rL/LB. In this ensemble, the GCA tolerance was 10−2, hence the abrupt cutoff at rL/LB = 10−2. The colour maps the counts on a logarithmic scale. The non-thermal electrons in the cluster around the O-type null point (of Fig. 5) are shown in blue. They all fall within the diagonal strand in the upper-right part of the histogram, where the relative energy gain is above 1 and rL/LB is above 10−4. The non-thermal electrons in the cluster around the X-type null point are shown in green and fall within the more diffuse diagonal strand below.
Current usage metrics show cumulative count of Article Views (full-text article views including HTML views, PDF and ePub downloads, according to the available data) and Abstracts Views on Vision4Press platform.
Data correspond to usage on the plateform after 2015. The current usage metrics is available 48-96 hours after online publication and is updated daily on week days.
Initial download of the metrics may take a while.