Open Access
Fig. A.2
Download original image
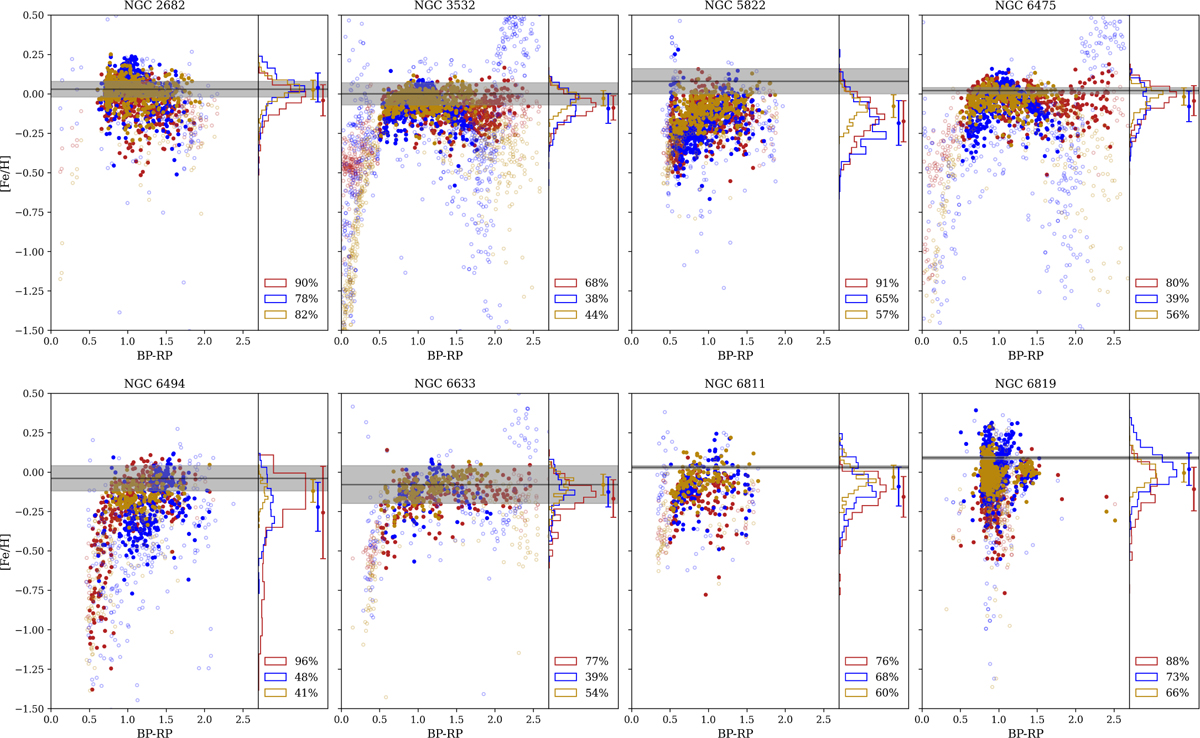
[Fe/H] estimates from three catalogues shown as a function of Gaia GBP − GRP colour for each cluster of the sample. The same colour-coding scheme and legend description apply as in Fig. A.1.
Current usage metrics show cumulative count of Article Views (full-text article views including HTML views, PDF and ePub downloads, according to the available data) and Abstracts Views on Vision4Press platform.
Data correspond to usage on the plateform after 2015. The current usage metrics is available 48-96 hours after online publication and is updated daily on week days.
Initial download of the metrics may take a while.