Fig. 5
Download original image
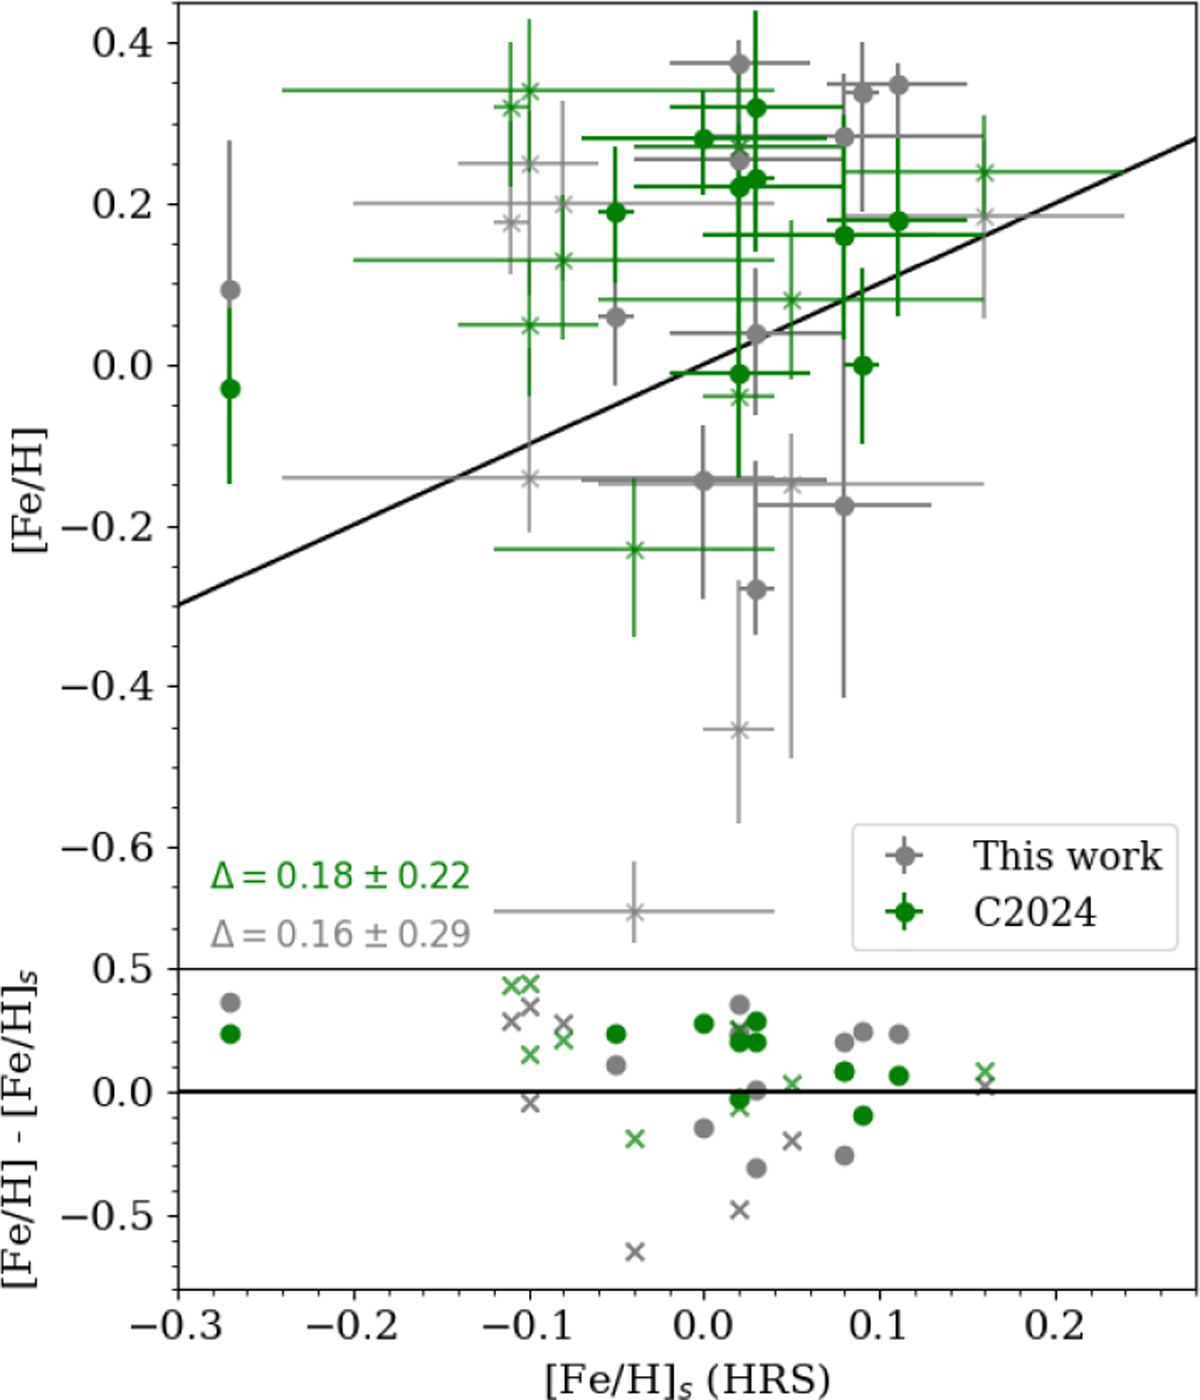
Metallicity of individual OCs of the HRS sample determined as a free parameter in the procedure. The grey colour denotes this work; the green colour shows the predictions of the ANN of Cavallo et al. (2024). Figure layout is the same as in Fig. 4: X-axis shows the [Fe/H] from high-resolution spectroscopy, the bottom plot shows the difference between the values, and the black line indicates 1:1 relation on the top plot and difference of zero in the bottom plot. Clusters with three or fewer red giant branch (RGB) stars are marked with an X symbol. The number in the bottom left corner indicates the median difference and RMSD.
Current usage metrics show cumulative count of Article Views (full-text article views including HTML views, PDF and ePub downloads, according to the available data) and Abstracts Views on Vision4Press platform.
Data correspond to usage on the plateform after 2015. The current usage metrics is available 48-96 hours after online publication and is updated daily on week days.
Initial download of the metrics may take a while.