Fig. 8
Download original image
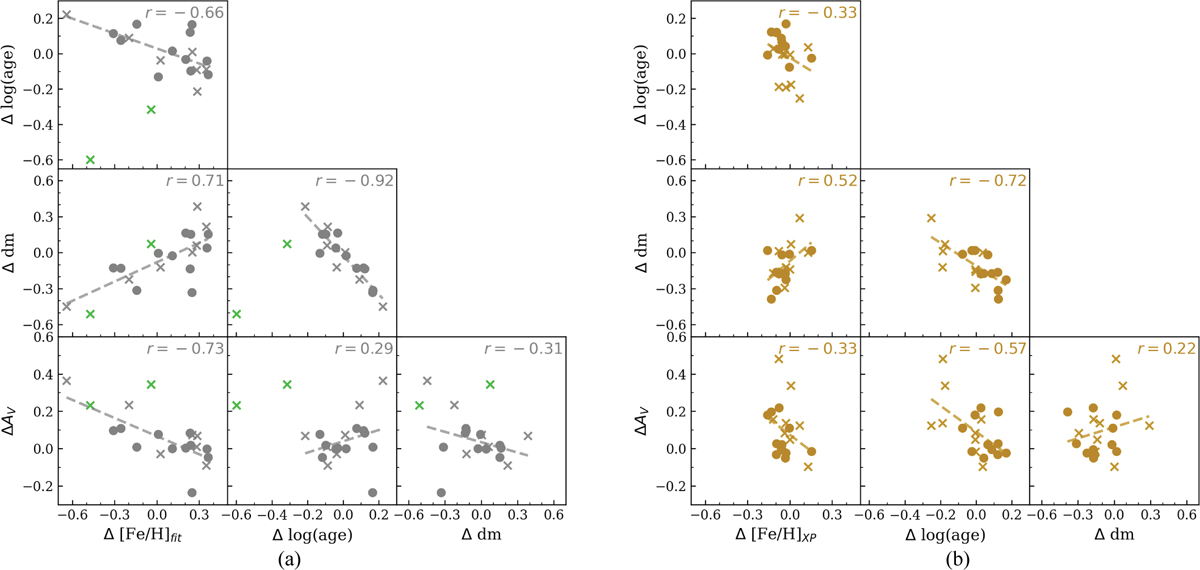
Corner plot of parameter offsets relative to B19 for the solutions performed (a) without a [Fe/H] prior and (b) with a [Fe/H] prior calculated from the FS catalogue. Two clusters with exceptionally large ∆log(a𝑔e) are marked with green markers and are excluded from the correlation calculation in the plot (a). The dashed lines show linear fits to the data, and the Pearson correlation coefficient r is shown for each pair of parameters. Clusters with unpopulated RGB are shown with an X marker.
Current usage metrics show cumulative count of Article Views (full-text article views including HTML views, PDF and ePub downloads, according to the available data) and Abstracts Views on Vision4Press platform.
Data correspond to usage on the plateform after 2015. The current usage metrics is available 48-96 hours after online publication and is updated daily on week days.
Initial download of the metrics may take a while.