Fig. 5
Download original image
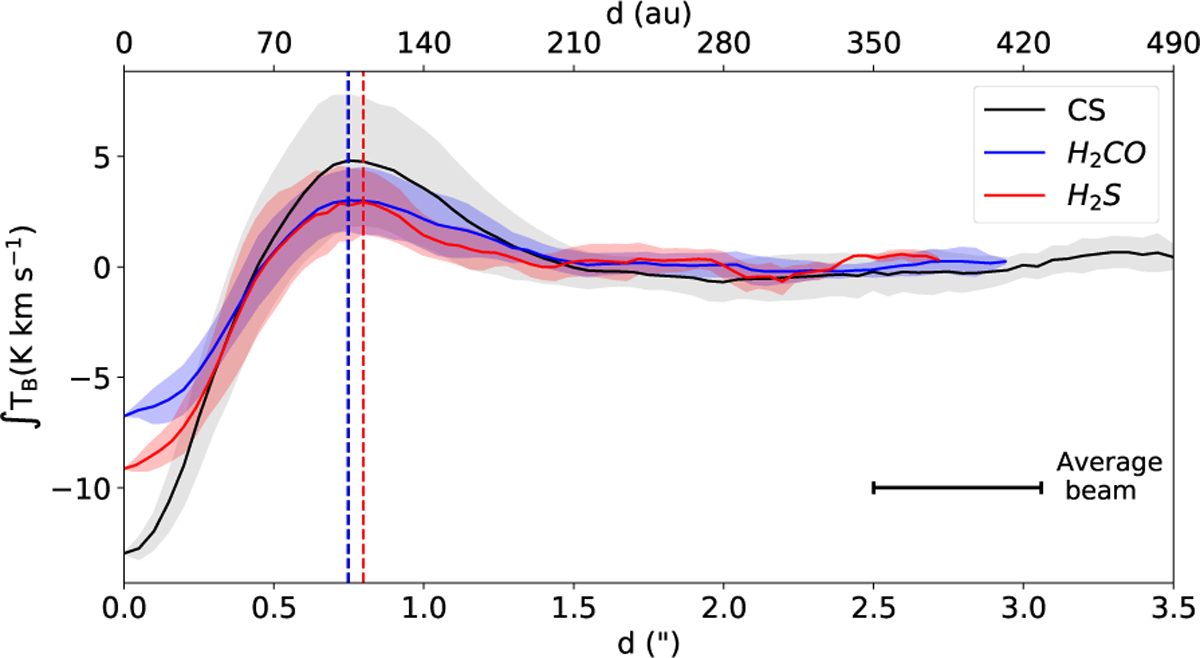
Radial profiles of the species detected in our survey. The radial profiles were computed on deprojected maps assuming i=46.7° and PA=138°. The shaded area around each profile accounts for the standard deviation at each radial bin. The dashed vertical lines mark the position of the radial emission peaks. The black line in the bottom right corner shows the average beam size.
Current usage metrics show cumulative count of Article Views (full-text article views including HTML views, PDF and ePub downloads, according to the available data) and Abstracts Views on Vision4Press platform.
Data correspond to usage on the plateform after 2015. The current usage metrics is available 48-96 hours after online publication and is updated daily on week days.
Initial download of the metrics may take a while.