Fig. 6
Download original image
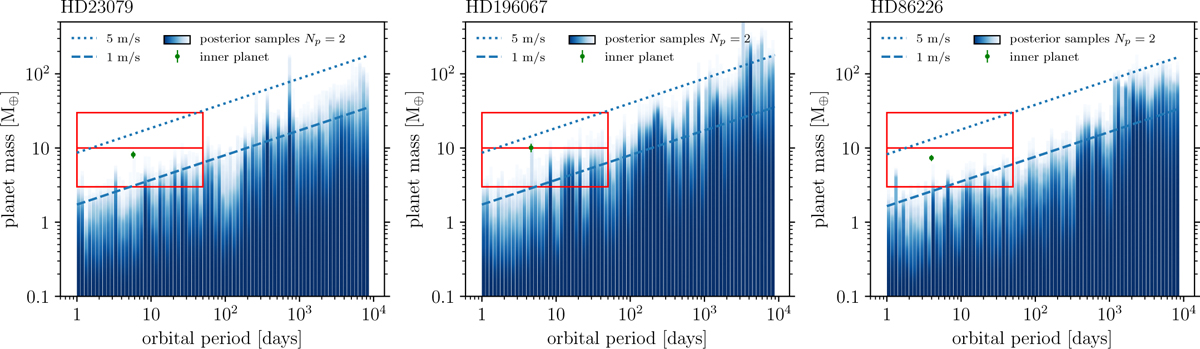
Compatibility limits from the analysis of the three targets (left: HD 23079, center: HD 196067, right: HD 86226). The plots show a color map of the posterior density for planet mass in orbital period bins, for all samples with Np = 2 (i.e., with a total of three Keplerians, including the OGP). Green points indicate detected inner planets with corresponding mass uncertainties. Dashed and dotted blue lines indicate masses corresponding to 1 and 5 m/s semi-amplitude Keplerians, respectively. Masses are calculated using the stellar masses from Table 1. Red boxes highlight the SE (3–10 m⊕) and NE (10–30 m⊕) mass ranges within 50 d.
Current usage metrics show cumulative count of Article Views (full-text article views including HTML views, PDF and ePub downloads, according to the available data) and Abstracts Views on Vision4Press platform.
Data correspond to usage on the plateform after 2015. The current usage metrics is available 48-96 hours after online publication and is updated daily on week days.
Initial download of the metrics may take a while.