Fig. 1
Download original image
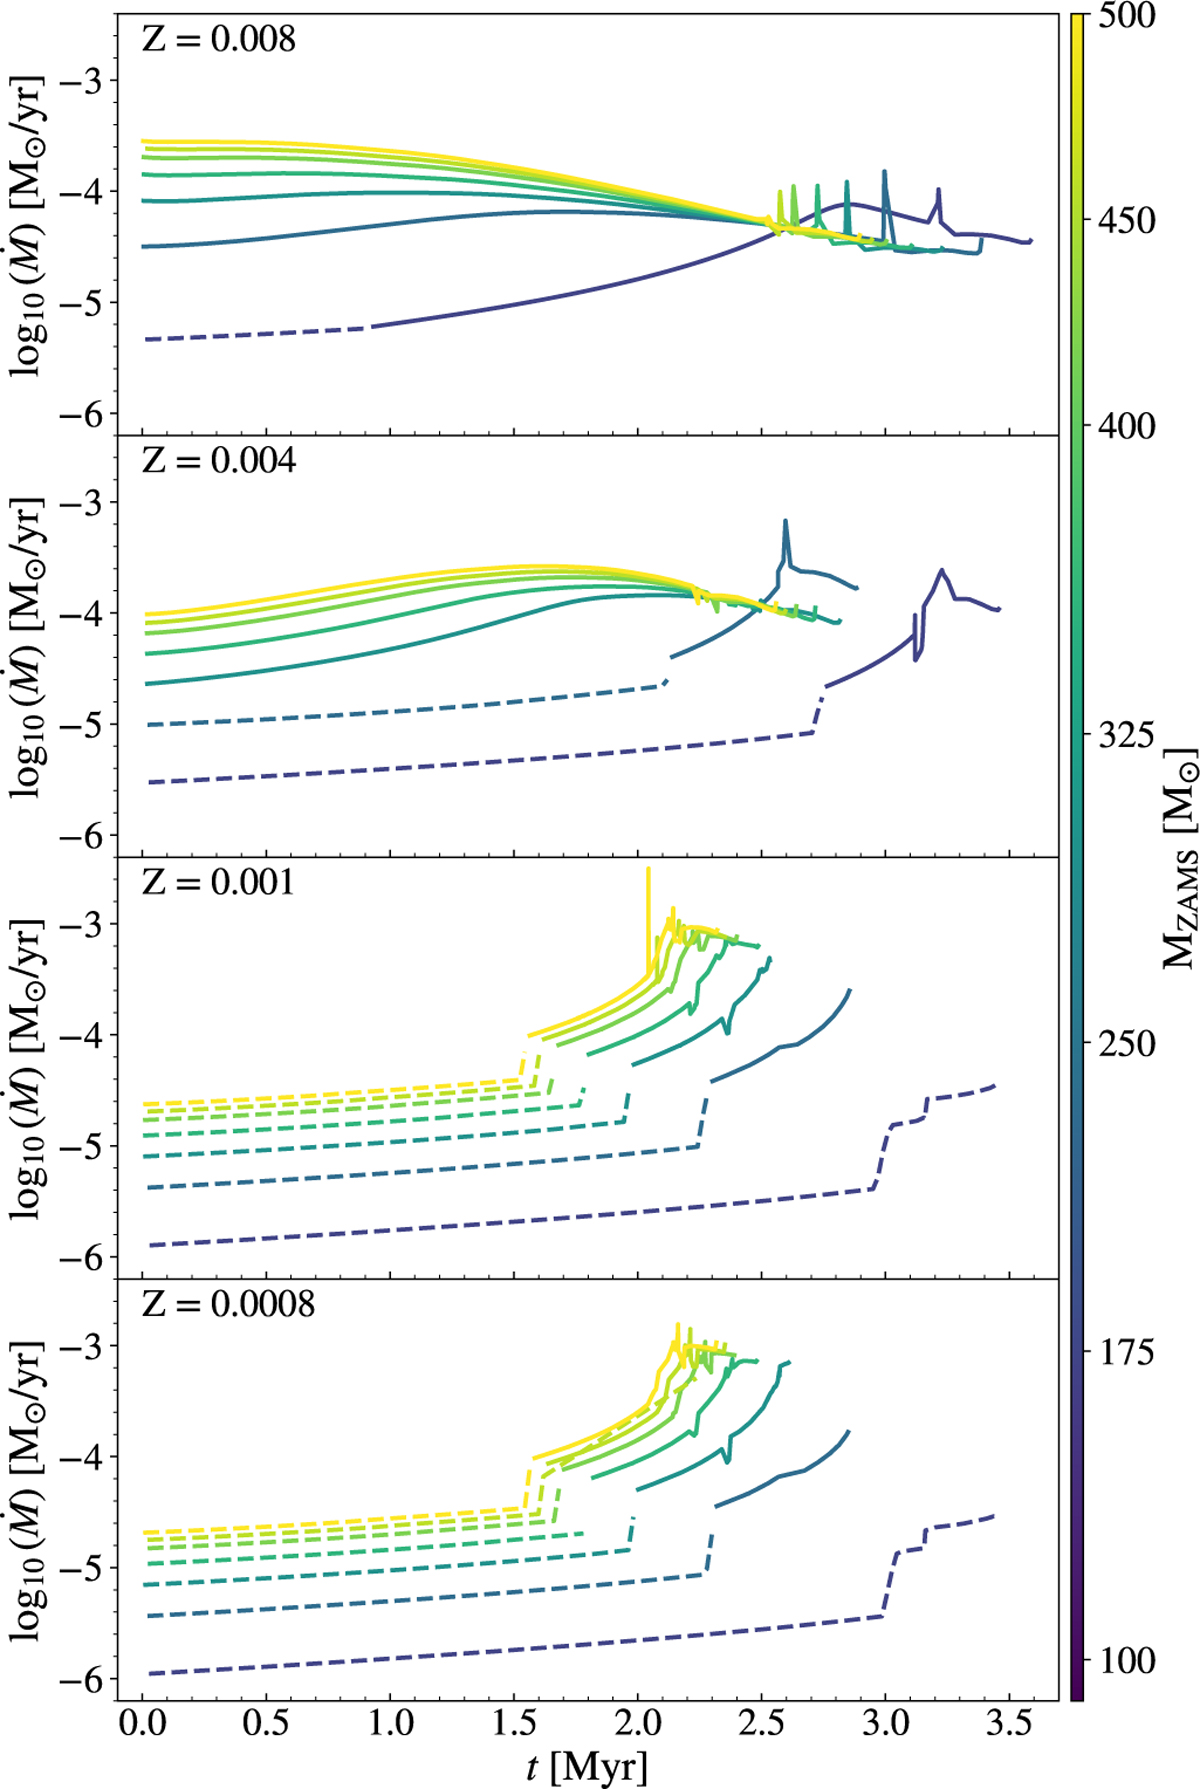
Mass-loss rate of our MESA models as function of time, from the ZAMS until the end of core He burning. The models adopt the winds by Sabhahit et al. (2023). From top to bottom: Z = 0.008, 0.004, 0.001, and 0.0008. The solid lines correspond to the evolutionary phase in which the stellar models are in the optically thick regime (ΓEdd > ΓEdd,tr), while the dashed lines mark the optically thin regime.
Current usage metrics show cumulative count of Article Views (full-text article views including HTML views, PDF and ePub downloads, according to the available data) and Abstracts Views on Vision4Press platform.
Data correspond to usage on the plateform after 2015. The current usage metrics is available 48-96 hours after online publication and is updated daily on week days.
Initial download of the metrics may take a while.