Fig. 10
Download original image
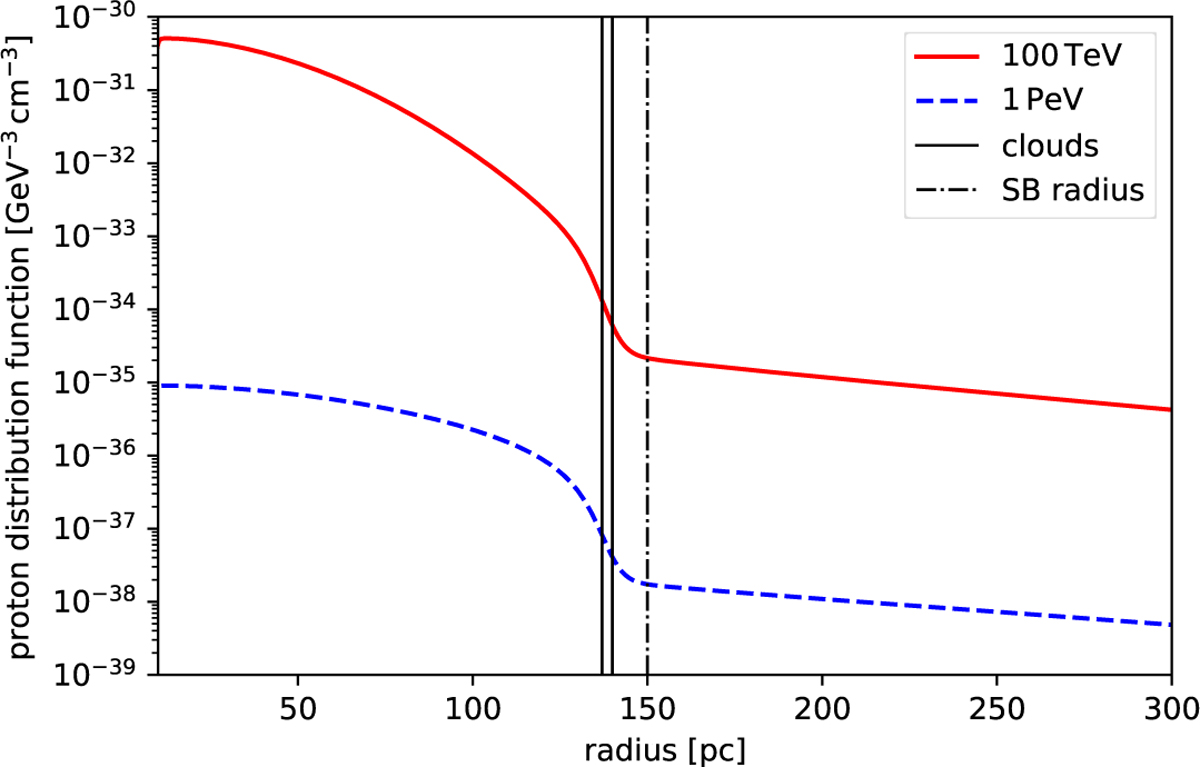
Proton distribution function as a function of radius at 100 TeV (blue-dashed line) and 1 PeV (red-solid line). The dash-dotted vertical line marks the superbubble radius, which separates the low-diffusion and interstellar-medium diffusion zones. The solid vertical lines indicate the positions of molecular clouds in the model. The relative normalisation between the two displayed proton distributions changes strongly at small radii, which results in energy dependent morphology (see Fig. 9).
Current usage metrics show cumulative count of Article Views (full-text article views including HTML views, PDF and ePub downloads, according to the available data) and Abstracts Views on Vision4Press platform.
Data correspond to usage on the plateform after 2015. The current usage metrics is available 48-96 hours after online publication and is updated daily on week days.
Initial download of the metrics may take a while.