Fig. 9
Download original image
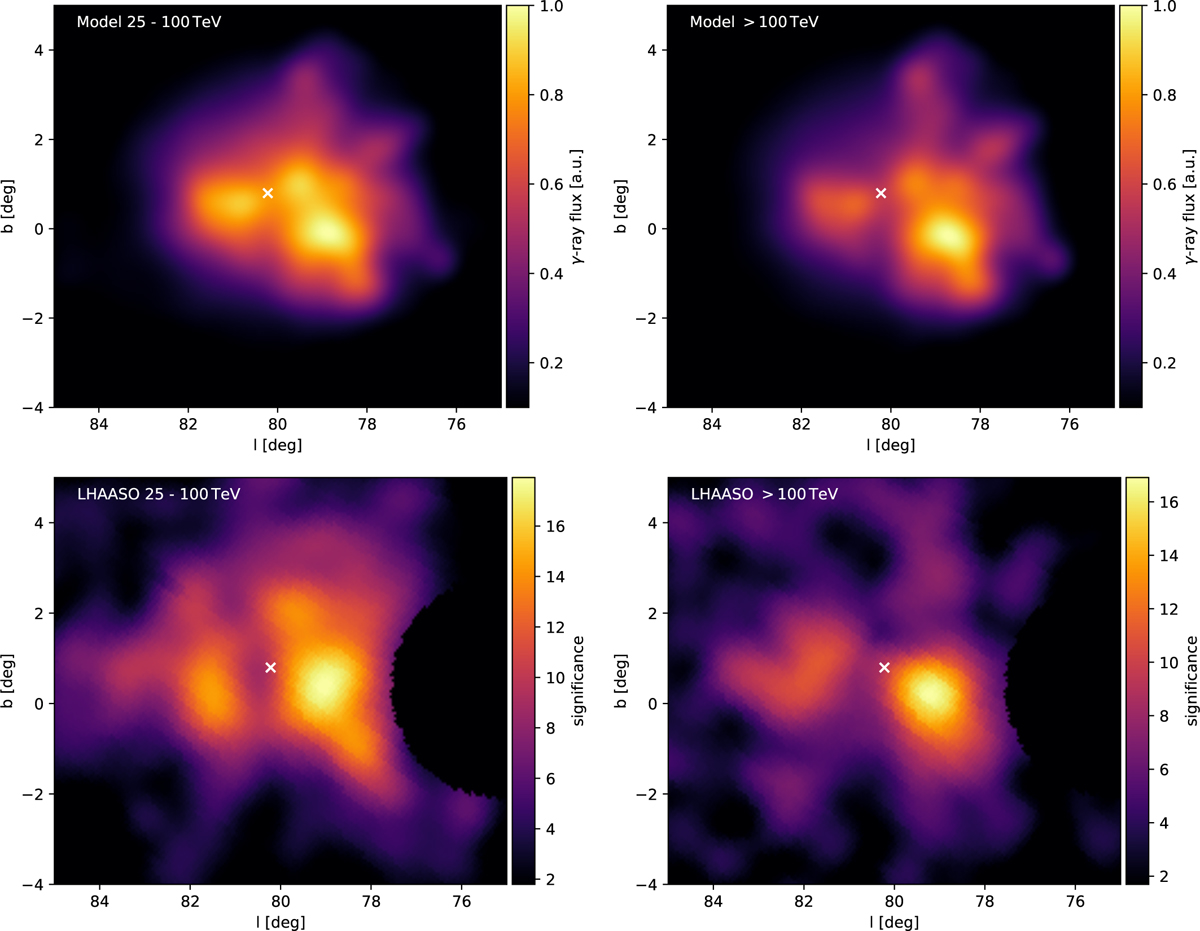
Synthetic γ-ray emission maps (top row) and significance maps from LHAASO Collaboration (2024a) (bottom row). Both the model and data have been smoothed using a Gaussian kernel of σ = 0.3°. The top of the colour scale is set to the maximum and the bottom to 10% of the maximum. The white cross marks the position of the stellar association Cygnus OB2. The figure demonstrates that the model is in good agreement with the γ-ray morphology and its energy dependence.
Current usage metrics show cumulative count of Article Views (full-text article views including HTML views, PDF and ePub downloads, according to the available data) and Abstracts Views on Vision4Press platform.
Data correspond to usage on the plateform after 2015. The current usage metrics is available 48-96 hours after online publication and is updated daily on week days.
Initial download of the metrics may take a while.