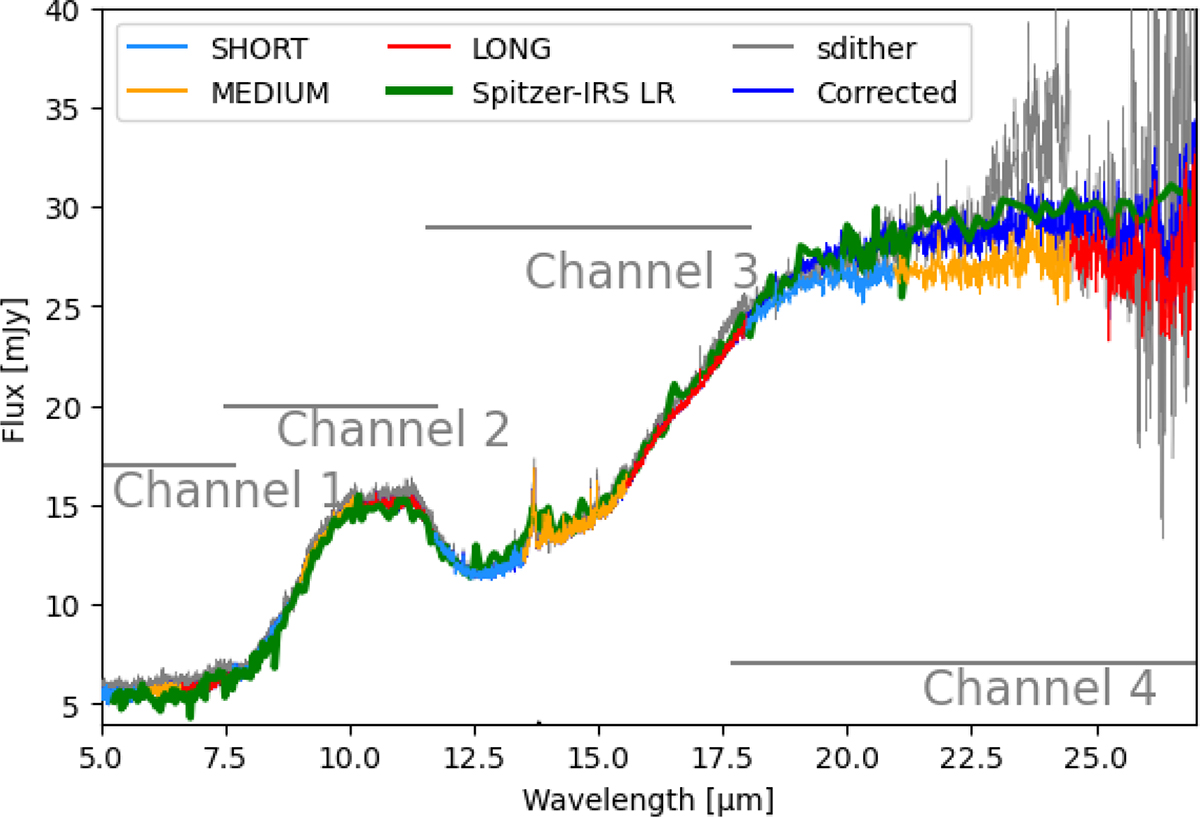
Fig. 1.
Download original image
MIRI Cha Hα 1 reduced spectra. Blue, yellow, and red colors denote the SHORT, MEDIUM, and LONG bands respectively for each channel of the ddither approach. The gray line shows the sdither reduction and the blue spectrum is the final flux-corrected one in Ch. 4. The green line corresponds to the Spitzer Cha Hα 1 low resolution spectrum obtained from CASSIS (Lebouteiller et al. 2011).
Current usage metrics show cumulative count of Article Views (full-text article views including HTML views, PDF and ePub downloads, according to the available data) and Abstracts Views on Vision4Press platform.
Data correspond to usage on the plateform after 2015. The current usage metrics is available 48-96 hours after online publication and is updated daily on week days.
Initial download of the metrics may take a while.