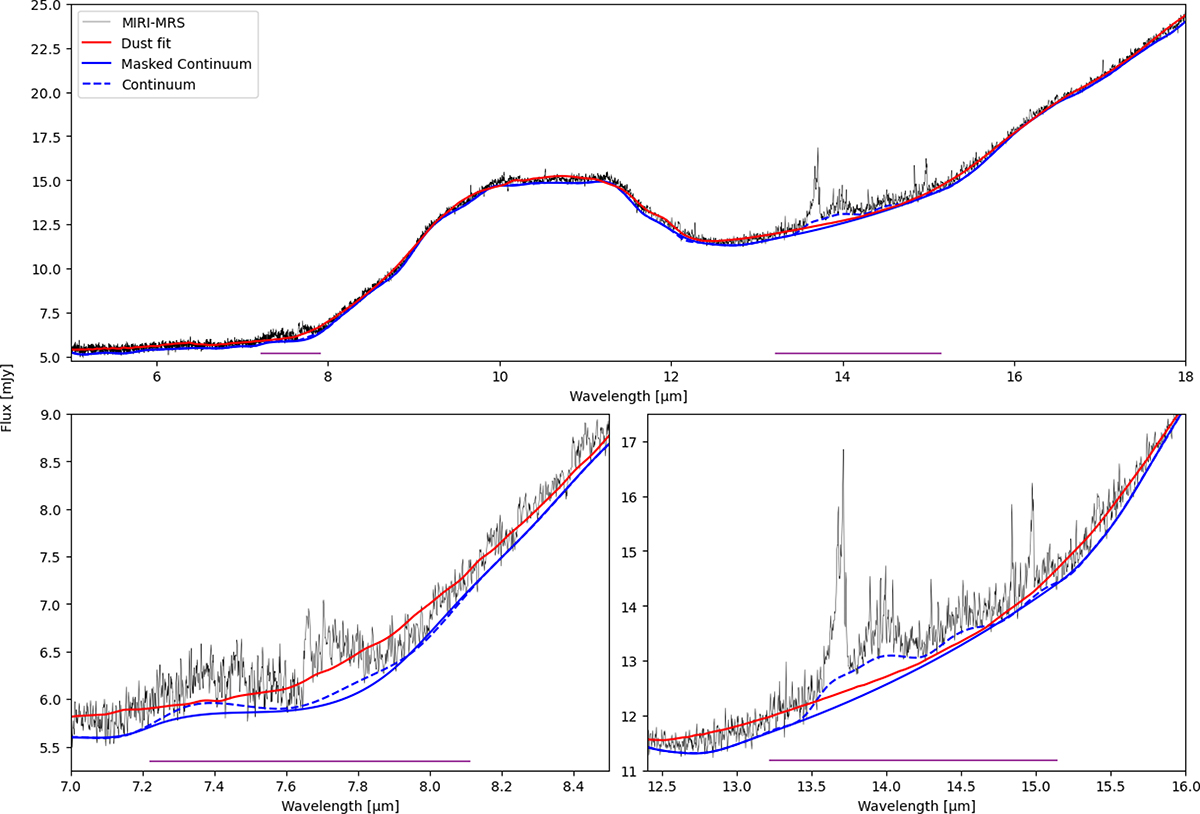
Fig. A.1.
Download original image
Continuum determination is shown in the top panel. The lower panels are zooms of the regions around 7.7 μm (left) and 14 μm (right). The red line represents the dust fit performed in Section 3. The dashed blue line is the continuum resulting from using a small width Savitzky-Golay filter. The final masked continuum adopted in this work is the solid blue line while the windows masked are represented by horizontal lines at the bottom of each panel
Current usage metrics show cumulative count of Article Views (full-text article views including HTML views, PDF and ePub downloads, according to the available data) and Abstracts Views on Vision4Press platform.
Data correspond to usage on the plateform after 2015. The current usage metrics is available 48-96 hours after online publication and is updated daily on week days.
Initial download of the metrics may take a while.