Open Access
Fig. B.2.
Download original image
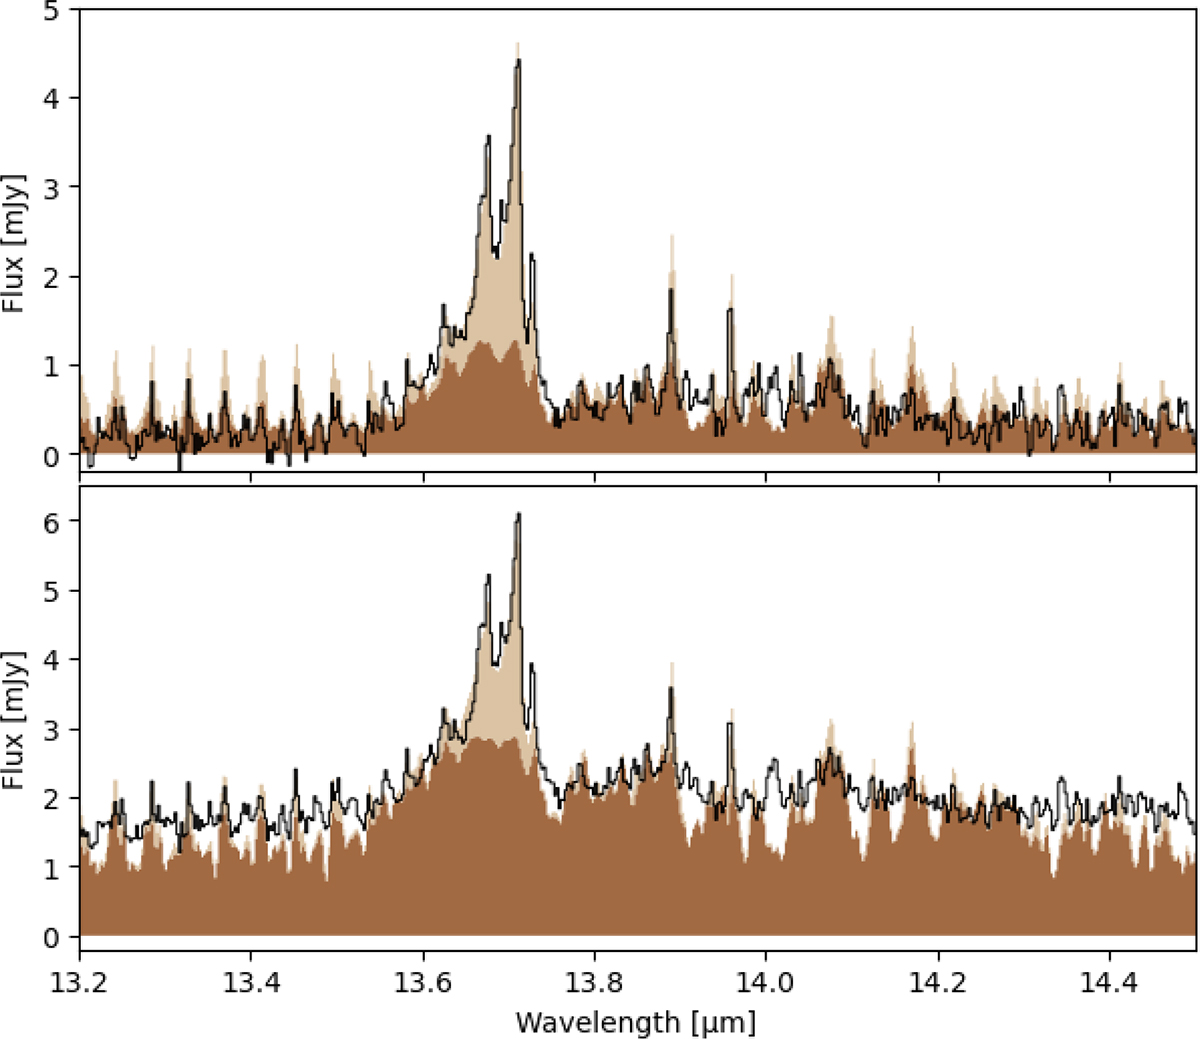
Continuum test. Comparison of the C2H2 slab model result from the best fit used in this work (upper panel) and using the continuum shown in green in Fig. A.1 (lower panel). Both panels show a fit using two C2H2 slab models with higher (dark brown) and lower (light brown) column densities.
Current usage metrics show cumulative count of Article Views (full-text article views including HTML views, PDF and ePub downloads, according to the available data) and Abstracts Views on Vision4Press platform.
Data correspond to usage on the plateform after 2015. The current usage metrics is available 48-96 hours after online publication and is updated daily on week days.
Initial download of the metrics may take a while.