Open Access
Fig. D.1.
Download original image
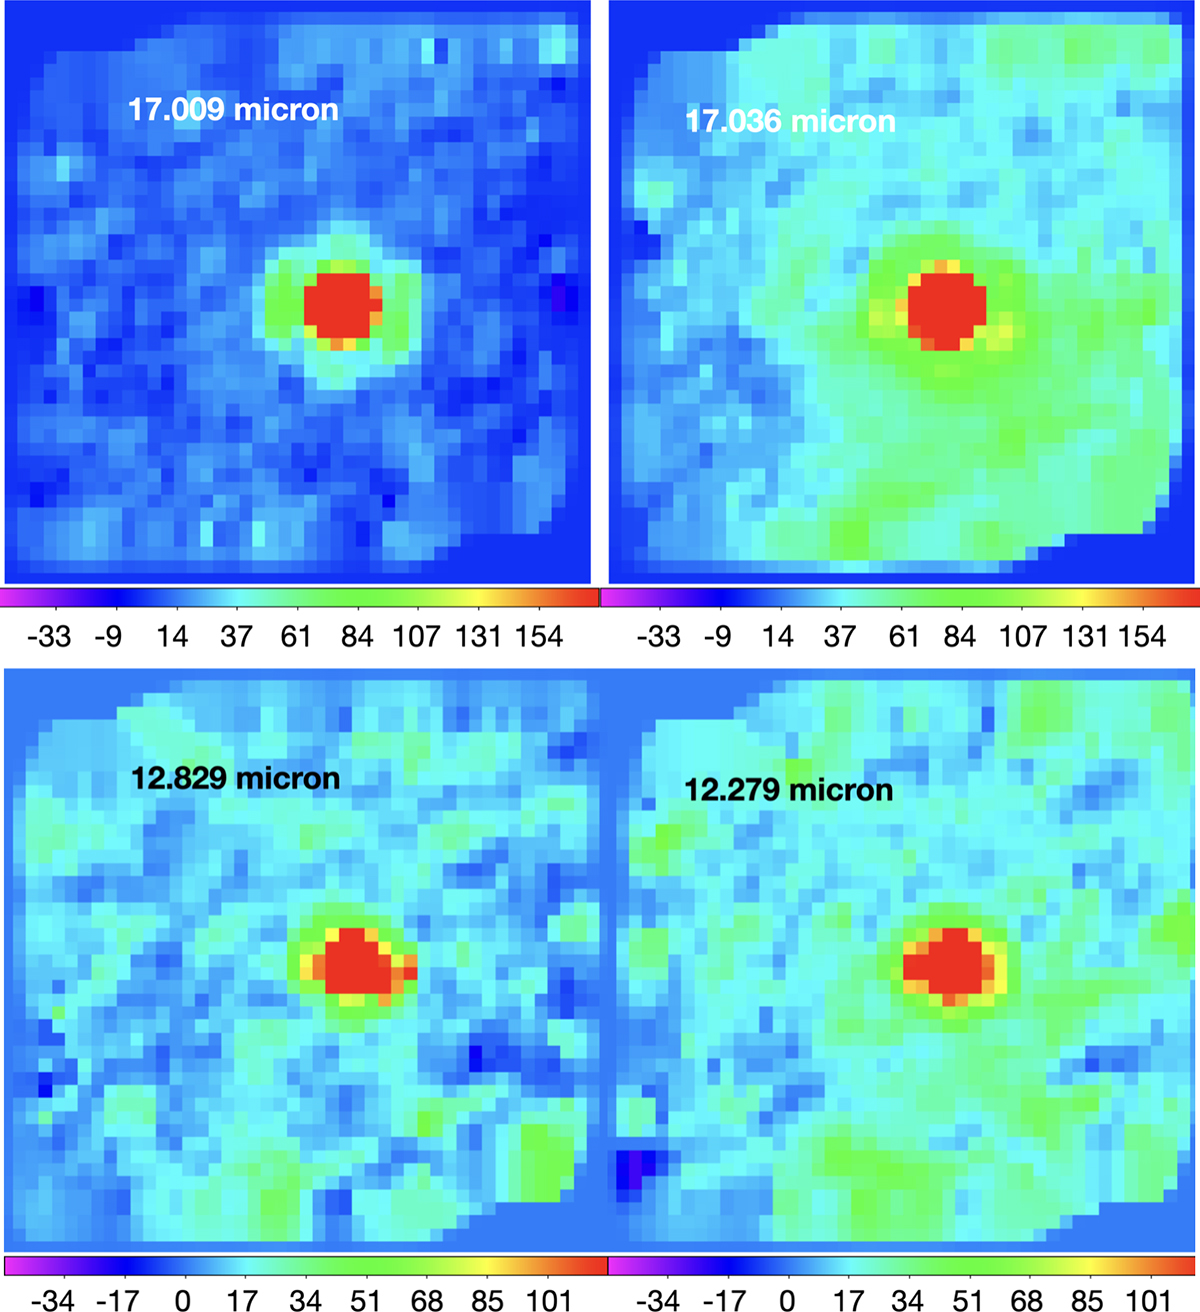
IFU aligned images of the H2 S(1) line. The panels on the left show wavelengths with no emission at 17.009 μm (top) and 12.829 μm (bottom). The right panels show the emission at the line rest-wavelengths for H2 S(1) at the top and H2 S(2) at the bottom.
Current usage metrics show cumulative count of Article Views (full-text article views including HTML views, PDF and ePub downloads, according to the available data) and Abstracts Views on Vision4Press platform.
Data correspond to usage on the plateform after 2015. The current usage metrics is available 48-96 hours after online publication and is updated daily on week days.
Initial download of the metrics may take a while.