Open Access
Fig. 2.
Download original image
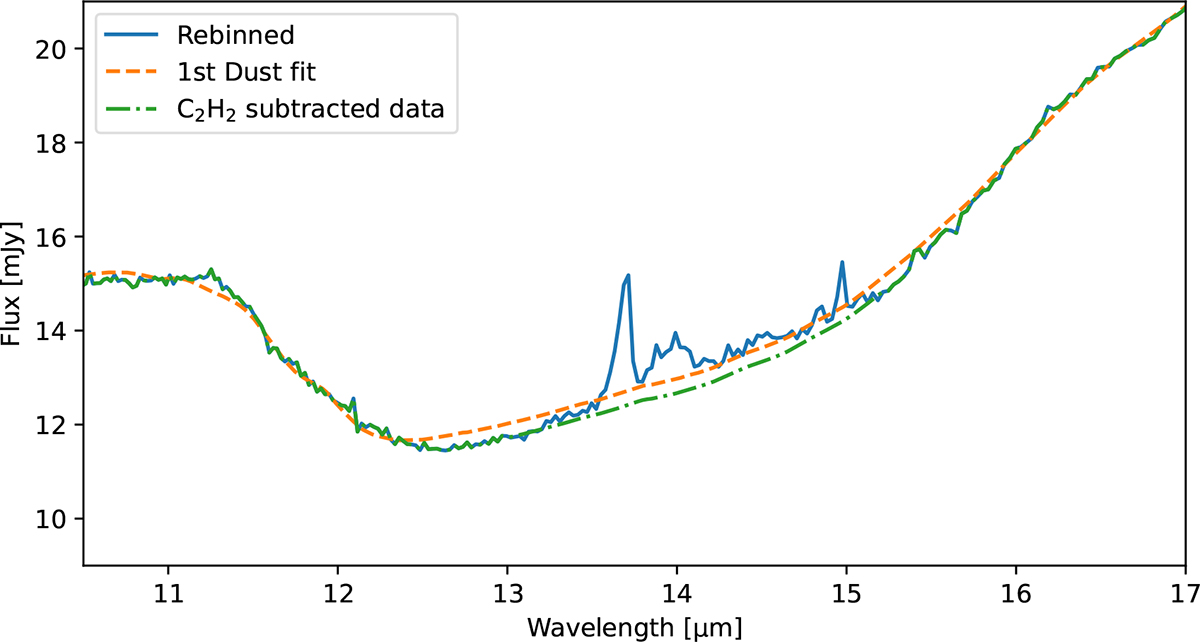
Comparison between spectra before and after the residual gas subtraction. The blue line is the rebinned (R ∼ 500) MINDS data, and the orange line is the first dust fitting. The green line corresponds to the C2H2 subtracted data.
Current usage metrics show cumulative count of Article Views (full-text article views including HTML views, PDF and ePub downloads, according to the available data) and Abstracts Views on Vision4Press platform.
Data correspond to usage on the plateform after 2015. The current usage metrics is available 48-96 hours after online publication and is updated daily on week days.
Initial download of the metrics may take a while.