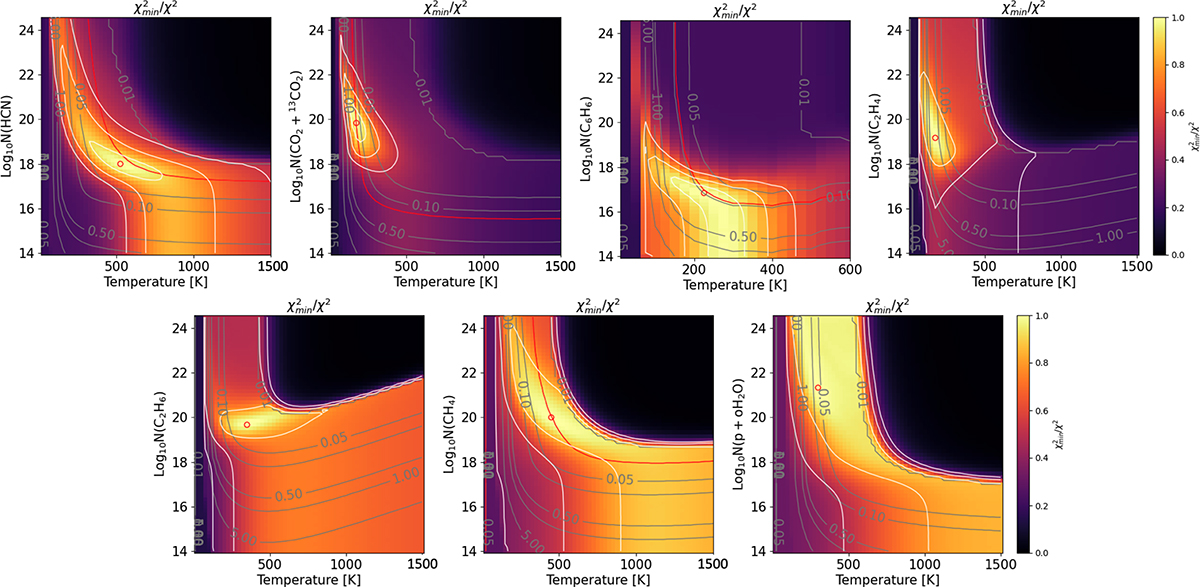
Fig. 4.
Download original image
The χ2 maps for HCN, CO2 + 13CO2, C6H6, C2H4, C2H6, CH4, and water. The color scale shows the χmin2/χ2. The best fit model (χmin2/χ2 = 1) is marked with a red circle. A red contour denotes the emitting region radius as listed in Table 2. Gray contours show the emitting radii in au while white contours represent the 1σ, 2σ, and 3σ levels.
Current usage metrics show cumulative count of Article Views (full-text article views including HTML views, PDF and ePub downloads, according to the available data) and Abstracts Views on Vision4Press platform.
Data correspond to usage on the plateform after 2015. The current usage metrics is available 48-96 hours after online publication and is updated daily on week days.
Initial download of the metrics may take a while.