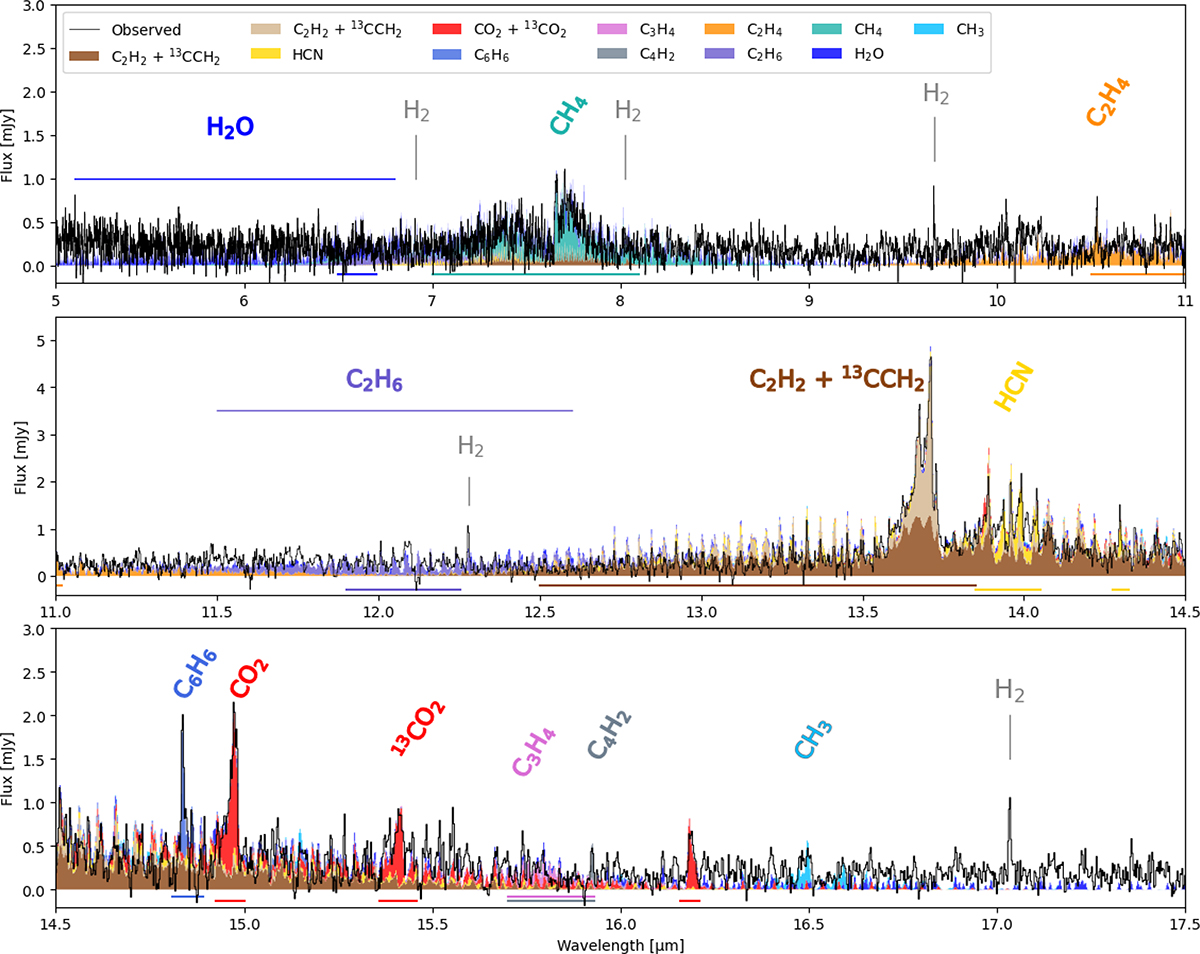
Fig. 5.
Download original image
Cha Hα 1 spectrum, with the JWST-MIRI continuum subtracted data (black) compared to the stacked emission from the slab models for C2H2 + 13CCH2, HCN, CO2 + 13CO2, C6H6, C3H4, C4H2, C2H4, C2H6, CH4, H2O, and CH3. The parameters of the slab models shown can be found in Tables 2 and C.1. The H2 lines are also marked. Horizontal lines represent the windows in which the χ2 for each fitting has been evaluated. We note that the y axis is different for each panel.
Current usage metrics show cumulative count of Article Views (full-text article views including HTML views, PDF and ePub downloads, according to the available data) and Abstracts Views on Vision4Press platform.
Data correspond to usage on the plateform after 2015. The current usage metrics is available 48-96 hours after online publication and is updated daily on week days.
Initial download of the metrics may take a while.